Exchange Blog Cryptocurrency Blog


FXOpen Trader
-
Posts
3,619 -
Joined
-
Last visited
-
Days Won
6
Posts posted by FXOpen Trader
-
-
On 2/6/2021 at 11:12 PM, Tindenucac said:
psychology, like other parameters of a person's approach to trading, weigh too much to ignore
We must try to manage our trading psychology so that it will not affect our trading and the profits.
-
On 2/6/2021 at 11:13 PM, Tindenucac said:
successful traders work only with reliable and high-quality brokers, this is true
The forex traders must understand that getting profits will not be easy and the ability to do more efforts and hardworking also.
-
On 2/6/2021 at 11:23 PM, Tindenucac said:
a trader must control any of his emotions if he wants to work profitably
Many times it will happen that we will be using emotions in our trading that can give us more losses than profit .
-
On 2/6/2021 at 11:25 PM, Tindenucac said:
I completely agree with you, it all depends on the person himself and his desire to work in this area
We must try to generate interest in Forex trading and only do such trading activity which can give us profit .
-
On 2/6/2021 at 11:38 PM, Tindenucac said:
look for a reliable option for yourself, for a long time I chose Expetoption, an excellent platform for those who love trading and appreciate the stability and reliability of work
I choose to do my trading with international and reputed Forex broker FXOpen because of peace of mind.
-
On 2/9/2021 at 7:08 PM, gds221 said:
Everyone can work, the main thing then does not whine and do not say that forex is loss and cheating in general.
It is true that many times we can get losses in to our trading account so we need to be careful about that.
-
On 2/9/2021 at 7:16 PM, gds221 said:
Scalping is far from the most pleasant option for work. As for me, it is worth being as attentive as possible.
Doing our trading with the help of scalping will not be easy because we will need to do fast trading.
-
On 2/9/2021 at 7:12 PM, gds221 said:
I work with a broker from Amarkets, and I think it's very important to be able to work by hand. At least I like that way a lot more.
I am doing Forex trading with the help of International and reputed Forex Broker FXOpen which allowed me to do my trading with success.
-
On 2/9/2021 at 7:18 PM, gds221 said:
As for me, it is extremely important for a trader to monitor absolutely all the parameters of work. Trading is far from an industry where you can not pay attention to something.
When we are doing our trading we must monitor our trading so that we can get good results.
-
On 2/9/2021 at 7:39 PM, gds221 said:
As for me, the best option is to improve the parameters of work is training. This is really the easiest way out of the situation.
Forex trading business will need time from our side so we must give proper time and be ready for getting success.
-
On 2/10/2021 at 8:32 AM, maspluto said:
that's why don't forget to be able to do training and learning well, this is needed and necessary so that traders can be maximized in carrying out trading activities that match expectations while on a real Tickmill account.
When we are making better use of our learning facilities then we can make more profits and become good traders also.
-
On 2/9/2021 at 7:49 PM, Viran said:
The main thing is to competently be able to combine these things if you want to be successful in this area.
We must try to make efforts and do such type of trading that can give us more profits.
-
On 2/10/2021 at 6:49 PM, Namu said:
therefore every trader must learn from a big risk, and at the Tickmill broker, what spread and leverage is given to traders, can traders trade by scalping, and how can traders find a good server at the Tickmill broker to apply scalping trading?
We must not take more risk in our trading and always to state of traits that can give us more profit.
-
On 2/10/2021 at 6:55 PM, gds221 said:
It is extremely important for beginners to start working with a demo account. When I started working with a broker from Amarkets, I started with the process of trading training on the demo regime. As for me, this is a really important aspect.
When we are making use of the demo trading facilities then we must also understand that we need to to use them correctly.
-
On 2/10/2021 at 6:58 PM, gds221 said:
I wouldn't say it's worth paying attention to. As for me, statistics do not show what to pay attention to.
The loss can come in our trading at any time so we need to be careful and try to avoid the losses in our accounts.
-
On 2/10/2021 at 6:59 PM, gds221 said:
I wonder if everything was so unequivocal about the strategy - why would they come up with new strategies? It is logical that there is simply no better strategy.
We must understand that if we are using a trading strategy that is easy for us then we can make profits from that.
-
On 2/10/2021 at 7:25 PM, Sanin said:
I believe if the managers work well and are always in touch with the client when he needs it, then the broker is really reliable, which is why I trade with Amarkets.
I am doing my Forex trading with international and reputed Forex broker FXOpen which allows hedging and scalping.
-
On 2/10/2021 at 7:32 PM, Sanin said:
In reality, because of such brokers, the general opinion about the forex sphere is very bad.
Forex trading is an international and a reputed business in which you can make money if you are having skills about trading in the currency markets.
-
On 2/10/2021 at 7:34 PM, Sanin said:
That's for sure. There are people who find it easy enough, and there are those who make a lot of effort.
We have to spend time in the forex trading business and also make more efforts so that we can learn and understand this business easily.
-
10 hours ago, gds221 said:
Usually, beginners believe that making money is easy, and in the end they can simply lose money. When I started working with a broker from Amarkets, I learned to work on a demo account for quite a long time.
With the use of a demo trading account we can learn the Forex trading skills and also without any losses.
-
10 hours ago, gds221 said:
From experience, I can say that there is simply no single path to achieving success - the options for solving the problem can be different.
We must try to increase our trading knowledge and also spend time in the forex markets.
-
LTC and EOS – Resistance seen but for how long?

LTC/USD
The price of Litecoin has been increasing in the past week, and from last Thursday when it was sitting at $141.27 at its lowest, we have seen an increase of 37.8$ measured to its highest point yesterday at $194.31. Since then the price made a pullback to $170.54 but is again back in an upward trajectory, currently sitting at $188.
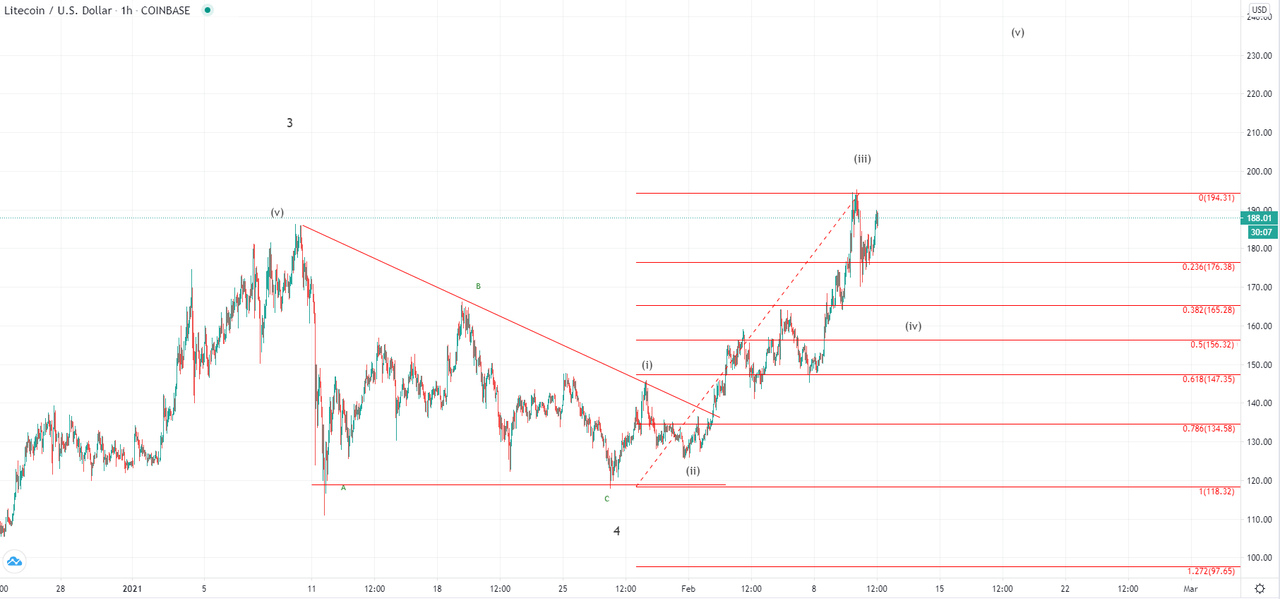
On the hourly chart, we can see that the price broke the prior high made on the 10th of January when the price of Litecoin was sitting at $185.58. This confirmed the impulsiveness behind the move and that the previous correction ended at $118. We have seen the development of the 3rd sub-wave of the higher degree impulse which is why further upside would be expected. However if yesterday’s high was the end of the 3rd wave, now the price might be set for a local correction.
Wave 4 should develop optimally to the 0.382 Fibonacci level which would bring the price of Litecoin to $165. But when the price tested prior resistance for support and confirms the bullish interest it is likely to continue moving past yesterday’s high and end around $230 before the completion of this five-wave move.
-
EUR/USD Showing Positive Signs, USD/JPY Turns Red

EUR/USD started a fresh increase after testing the 1.1950 support zone. USD/JPY declined below the 105.00 support and tested the 104.50 zone.
Important Takeaways for EUR/USD and USD/JPY
- The Euro found support near the 1.1950 region and it started a fresh increase above 1.2050.
- There is a key bullish trend line forming with support near 1.2100 on the hourly chart of EUR/USD.
- USD/JPY declined heavily below the 105.20 and 105.00 support levels.
- There was a break below a major bullish trend line with support at 105.30 on the hourly chart.
EUR/USD Technical Analysis
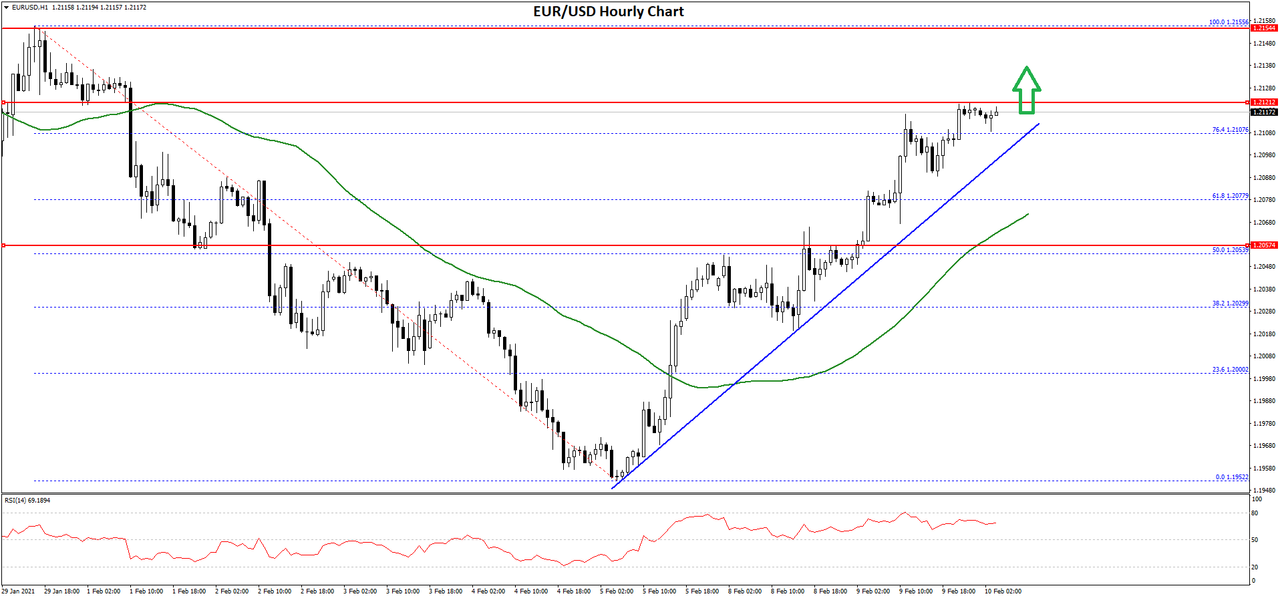
This past week, the Euro declined below the 1.2050 and 1.2000 support levels against the US Dollar. The EUR/USD pair traded close to the 1.1950 zone, where it found support.
A low was formed near 1.1952 on FXOpen before the pair started a fresh increase. It climbed back above the 1.2000 level and the 50 hourly simple moving average. There was also a break above the 50% Fib retracement level of the downward move from the 1.2155 swing high to 1.1952 low.
It is now trading above the 76.4% Fib retracement level of the downward move from the 1.2155 swing high to 1.1952 low. There is also a key bullish trend line forming with support near 1.2100 on the hourly chart of EUR/USD.
An immediate resistance is near the 1.2120 level. The main resistance is near the 1.2155, above which EUR/USD is likely to accelerate higher towards the 1.2200 resistance area.
Conversely, the pair could start a fresh decline below the 1.2100 support and the trend line. The first major support is near the 1.2075 level and the 50 hourly simple moving average.
If there is a downside break below the 50 hourly simple moving average, the pair could dive towards the 1.2000 handle in the near term. Any more losses might call for a retest of the 1.1950 support level.
Read Full on FXOpen Company Blog...
-
BTC and XRP – Bullish momentum confirmed

BTC/USD
The price of Bitcoin has broken out from its prior resistance and impulsively came to $48,200 at its highest point today. From its lowest point on Sunda when it was sitting around $37,430, this is an increase of 28%. Currently, a minor retracement is being made with the price sitting at $46,604 but is still in an upward trajectoty.
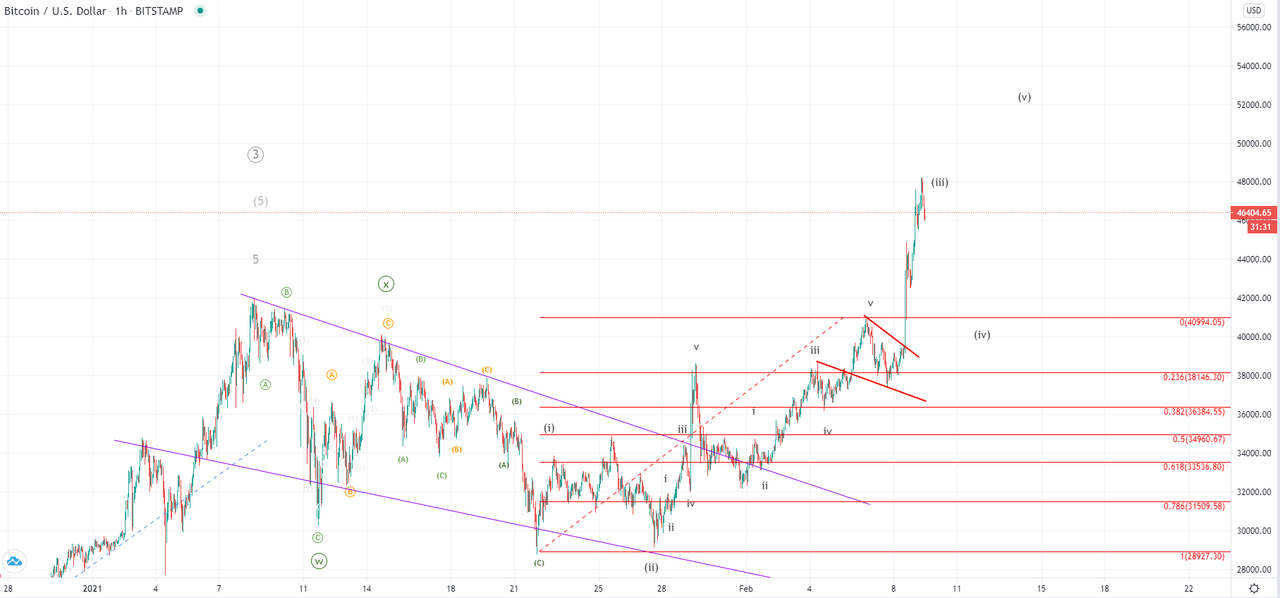
This breakout indicates that the prior correctional formation from the 10th of January has ended and now we have a clear confirmation with the bullish momentum indicating a strong uptrend continuation. After the five-wave move inside the ascending channel was ended we have seen a minor pullback but an immediate breakout to the upside. This was most likely the 3rd sub-wave of the higher degree 3rd wave which is why further upside movement would now be expected.
As the price is to develop its five-wave pattern further higher highs could be seen in the upcoming days with potentially exceeding the $60,000 mark by the end of its development. However not that an impulsive breakout has seen a local correction might form as the 4th wave should develop before further upside. It is still unclear where the 4th wave could land but most likely we are going to see a retest of the prior all-time high before uptrend continuation.
Daily Market Analysis By FXOpen
in Technical Analysis
Posted
Gold Price Starts Fresh Decline, Oil Price Correcting Gains
Gold price failed to clear the $1,855 resistance and started a fresh decline. Crude oil price is correcting gains and it might test the $57.00 support zone.
Important Takeaways for Gold and Oil
Gold Price Technical Analysis
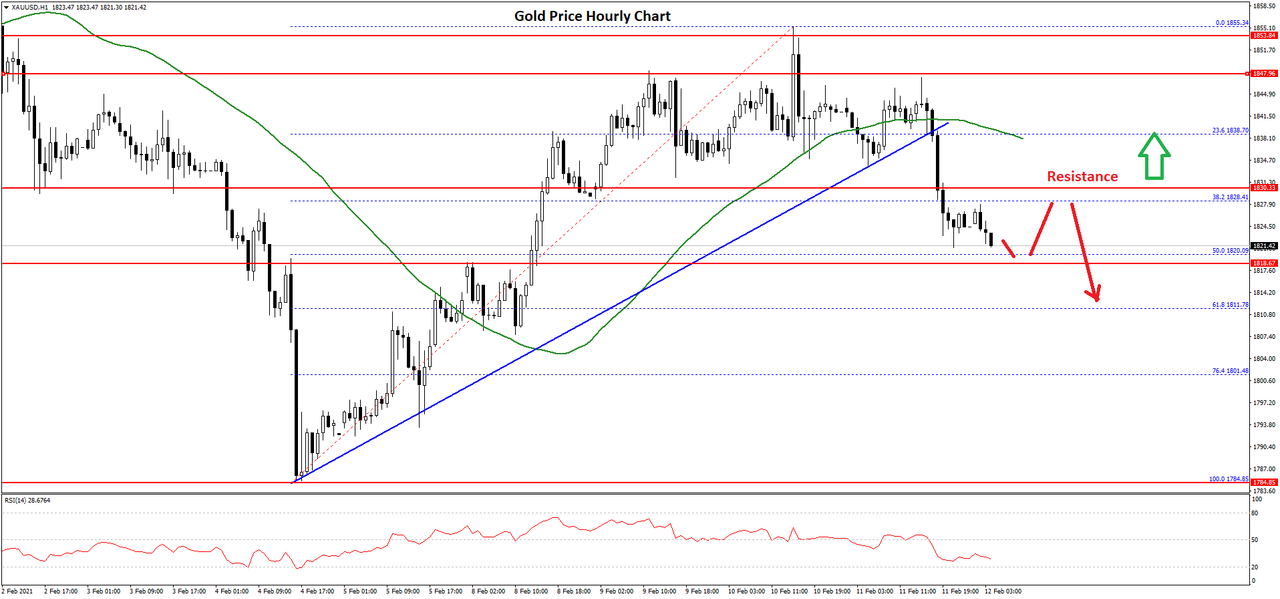
Gold price started a decent recovery wave from the $1,785 zone against the US Dollar. The price climbed above the $1,820 and $1,840 resistance levels.
However, the price struggled to clear the $1,855 and $1,860 resistance levels. A high was formed near $1,855 before the price started a fresh decline. There was a break below the $1,840 level and the 50 hourly simple moving average.
The price traded below the 38.2% Fib retracement level of the upward move from the $1,784 swing low to $1,855 high. There was also a break below a major bullish trend line with support near $1,838 on the hourly chart of gold.
The price is now approaching the $1,820 support zone. The 50% Fib retracement level of the upward move from the $1,784 swing low to $1,855 high is also near the $1,820 level.
If there is a downside break below the $1,820 support level, the price might continue to move down towards the $1,800 level. Any more losses could lead the price towards the $1,784 swing low.
On the upside, the price is likely to face resistance near the $1,830 level. The next major resistance is probably forming near the $1,840 level and the 50 hourly simple moving average.
Read Full on FXOpen Company Blog...