Exchange Blog Cryptocurrency Blog


riki143
-
Posts
6,870 -
Joined
-
Last visited
Posts posted by riki143
-
-
New Lucky T-Shirt Collection from FBS is now avaiable in your personal area! New styles, new designs and MORE PROFIT! Check it out and choose the one that fits you best. Happy Trading!
Link: https://goo.gl/Y5Jp2h

-
The investment strategy of NASSIM TALEB – A genius mathematician and Trader.
He started out as a trader, worked as a quantitative analyst and ran his own investment firm, but the more he studied statistics, the more he became convinced that the entire financial system was a keg of dynamite that was ready to blow. He predicted the financial crash and more. Read this interesting article here https://goo.gl/PBLLDr

-
FBS 7 MILLIONTH TRADER!
Link: https://goo.gl/ToKoeD
A story of how awesome and unpredictable life can be with FBS. Mr. Abdelrashed Eldamerdash Hamed Elsayed from Egypt opened his $50 Bonus account and then was surprised by a congratulatory phone call from FBS headquarters, telling him he is the 7 Millionth Trader and to choose a gift! Check out the full story!

-
USD/JPY Daily Analytics
15:14 23.03.2018

There's a bullish "High Wave", so we're likely going to have an upward correction soon. However, if a pullback from the Moving Averages happens little later on, there'll be an opportunity to have another decline.

The last bullish "Hammer" has been confirmed, so the price is rising. It's likely that the market is going to test the Moving Averages, which could be a departure point for a decline.
More:
-
EUR/USD Daily Analytics
15:12 23.03.2018

There's an "Inverted Hammer", so the price is rising. It's likely that bulls are going to test the nearest resistance area in the coming hours.
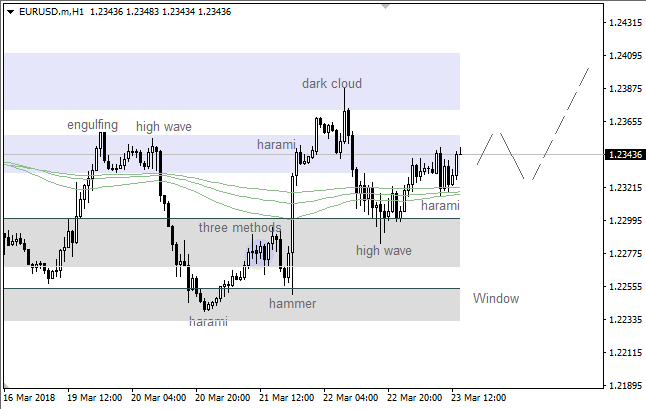
We've got a bullish "Harami", which has been confirmed enough. Also, there's a pullback from the Moving Averages, so the pair is likely going to continue moving up.
More:
-
EUR/GBP Daily Analytics
07:55 23.03.2018
Recommendations:
SELL 0.8785 SL 0.884 TP1 0.8695 TP2 0.8525 TP3 0.845
SELL 0.881 SL 0.8865 TP1 0.8695 TP2 0.8525 TP3 0.845
On the daily chart of EUR/GBP, there is a continuation of a medium-term consolidation in the range of 0.8695-0.9015 within the “Spike and ledge” pattern. The first break of its bottom line was unsuccessful, however, bears still hope and are ready to repeat the break after a small pullback.

On H1, there is a transformation of the AB=CD pattern to 5-0. Usually, pullbacks in the direction to 38.2%, 50%, and 61.8% are used for a formation of short positions.

More:
-
USD/JPY Daily Analytics
07:55 23.03.2018
Technical levels: support – 104.30, 103.50; resistance – 105.20.
Trade recommendations:
Sell — 105.20; SL — 105.40; TP1 — 104.30; TP2 — 103.50.
Reason: expanding bearish Ichimoku Cloud with falling Senkou Span A and B; the falling lines Tenkan-sen and Kijun-sen; the market made a new lows since Nov 2016.

More:
-
AUD/USD Daily Analytics
07:52 23.03.2018
Technical levels: support – 0.7690; resistance – 0.7730, 0.7780
Trade recommendations:
Sell — 0.7730; SL — 0.7750; TP1 — 0.7610; TP2 — 0.7580.
Reason: bearish Ichimoku Cloud with horizontal Senkou Span A and B; a cancelled dead cross of Tenkan-sen and Kijun-sen with the horizontal lines; the market had returned to negative area.

More:
-
EUR/USD Daily Analytics
07:20 23.03.2018
Recommendation:
SELL 1.2245 SL 1.23 TP1 1.2145 TP2 1.208 TP3 1.1965
BUY 1.2415 SL 1.236 TP1 1.2515 TP2 1.2615 TP3 1.2715
On the daily chart, EUR/USD is consolidating in the 1.2245-1.2415 range. A break below the lower border of the range will allow bears to pull the pair to 127.2% of the violet AB=CD. On the other hand, advance above resistance at 1.2415 will increase the odds of advance to 127.2% target of the green AB=CD.

On H1, EUR/USD keeps forming the junior “Widening wedge”.

More:
-
GBP/USD Daily Analytics
01:10 23.03.2018

There's a "Thorn" pattern, so the market is going to test the closest support at 1.4069 - 1.4027. If a pullback from these area happens little later on, there'll be an opportunity to have a bullish price movement.

The last "Thorn" pattern led to the current decline. The main target is the 89 Moving Average, which could be a starting point for another bullish rally.
More:
-
EUR/USD Daily Analytics
01:09 23.03.2018

The main trend is still bullish. It's likely that the pair is going to test the closest support at 1.2289 - 1.2259, which could be a departure point for another upward price movement.

The price has been declining since a "V-Top" pattern formed. The main intraday target is the nearest trend line. If a pullback from this level happens, there'll be an opportunity to have a bullish price movement towards the next resistance at 1.2358 - 1.2387.
More:
-
EUR/USD: THE BULLS RETURNING TO MARKET
07:45 22.03.2018
Technical levels: support – 1.2300, 1.2350; resistance – 1.2400.
More: https://goo.gl/sbC3dA
Trade recommendations:
Buy — 1.2360; SL — 1.2340; TP1 — 1.2400; TP2 — 1.2450
Reason: expanding bearish Ichimoku Cloud with rising Senkou Span A; a cancelled dead cross of Tenkan-sen and Kijun-sen with the rising lines; the market are returned into the positive area.

-
GBP/USD: POUND IS NEAR MAIN RESISTANCE
07:46 22.03.2018
Technical levels: support – 1.4140; resistance – 1.4200, 1.4250.
More: https://goo.gl/EtTejx
Trade recommendations:
Sell — 1.4200; SL — 1.4220; TP1 — 1.4140; TP2 — 1.4080.
Reason: bullish Ichimoku Cloud with rising Senkou Span A and B; a golden cross of Tenkan-sen and Kijun-sen with the rising lines; the market was supported by Kijun-sen, but now is overbought and it’s under strong resistance.

-
Do you have a question about any of FBS services, promotions, or even about Forex trading in general?
FBS support team is always ready to assist you, contact us now :
☑ Drop us a message to our Offical Facebook Page ➡ https://web.facebook.com/financefreedomsuccess/
☑ Ask for free call wherever you are in the world through our website callback service ➡ https://goo.gl/NGLQKH
☑ Send us an Email to: support@fbs.com
We care about your enquiries and will be happy to reply them all around the clock

-
GBP/USD Daily Analytics
07:46 22.03.2018
Technical levels: support – 1.4140; resistance – 1.4200, 1.4250.
Trade recommendations:
Sell — 1.4200; SL — 1.4220; TP1 — 1.4140; TP2 — 1.4080.
Reason: bullish Ichimoku Cloud with rising Senkou Span A and B; a golden cross of Tenkan-sen and Kijun-sen with the rising lines; the market was supported by Kijun-sen, but now is overbought and it’s under strong resistance.

More:
-
EUR/USD Daily Analytics
07:45 22.03.2018
Technical levels: support – 1.2300, 1.2350; resistance – 1.2400.
Trade recommendations:
Buy — 1.2360; SL — 1.2340; TP1 — 1.2400; TP2 — 1.2450
Reason: expanding bearish Ichimoku Cloud with rising Senkou Span A; a cancelled dead cross of Tenkan-sen and Kijun-sen with the rising lines; the market are returned into the positive area.

More:
-
USD/JPY Daily Analytics
07:06 22.03.2018
Recommendation:
SELL 105.35
SL 105.90
TP1 104.35 TP2 103.35 TP3 102.80
On the daily chart, the inability of bulls USD/JPY to bring the pair outside of the downtrend channel and keep them above 106.50 points at their weakness. To continue the decline towards 161.8% target of AB=CD, bears need a confident test of support at 105.35.

On H1, the transformation of the “Shark” into 5-0 allowed forming short positions. Triggering of AB=CD will allow bears to continue the decline towards 161.8%.

More:
-
EUR/JPY Daily Analytics
06:44 22.03.2018
Recommendation:
SELL 129.60 SL 130.05 TP1 128.60 TP2 127.60 TP3 126.00
BUY 132.15 SL 131.6 TP1 133.15 TP2 134.45 TP3 136.70
On the daily chart of EUR/JPY, a break of resistance at 132.25-132.50 will trigger the “Bat” pattern with a target at 88.6%. On the other hand, a slide to March minimum will allow bears to resume the decline towards 200% target of AB=CD.

On H1, a “Shark” is transforming into 5-0. A successful test of support at 129.60 will increase the risks of a further selloff. On the other hand, advance above resistance at 132.15 will create grounds for correction.

More:
-
USD/JPY Daily Analytics
01:11 22.03.2018

There're bearish patterns such a "High Wave" and a "Shooting Star". In this case, the pair is likely going to decline towards the last low in the short term.

We've got a bullish "Harami", so there's an opportunity to have a local upward correction. Nevertheless, the market is likely going to continue declining afterwards.
More:
-
EUR/USD Daily Analytics
01:09 22.03.2018

The price has been rising since a "Harami" formed. There's no any reversal pattern, so the market is likely going to test the next resistance area.

There's a local bearish "Harami", which hasn't been confirmed yet. It's likely that the market is going to test the Moving Averages, which could be a departure point for another bullish rally.
More:
-
GBP/USD Daily Analytics
01:05 22.03.2018

The last bullish "Flag" pushed the price higher. It's likely that the pair is going to continue moving up in the direction of another resistance at 1.4144 - 1.4277.

Bulls faced with resistance at 1.4144, so the price is consolidating. The nearest support at 1.4087 - 1.4069 could be a departure point for an upward price movement.
More:
-
EUR/USD Daily Analytics
01:03 22.03.2018


The last "Double Bottom" led to the current upward price movement. It's likely to have a local bearish correction during the day. The main intraday target is the next resistance at 1.2383 - 1.2396.
More:
-
Trading Schedule Changes
Important trading schedule changes due to Daylight Saving Time!
Check out the full schedule of changes and plan your trading accordingly.
FBS is always by your side.

-
Important Economic Events
The Federal Reserve is expected to raise interest rates at least three times this year. The firm economic growth and inflation in the United States give the central bank reasons to increase the interest rate this time.
If the Fed raises the rate, it will support the dollar that has been suffering for a long time. On the other hand, the absence of a rate hike will be a big disappointment and lead to a selloff in the USD.
The Fed’s decision will be known Today at 20:00 MT time.
Follow this event in the FBS economic Calendar https://goo.gl/ocsPGD

FBS.com - Daily/Weekly Analysis / Market News
in Technical Analysis
Posted