Exchange Blog Cryptocurrency Blog


riki143
-
Posts
6,870 -
Joined
-
Last visited
Posts posted by riki143
-
-
⚜TRADE GOLD WITH FBS.⚜
Gold prices (XAU/USD) opened the year with $1,309.65 and it has been growing since then. Geopolítical tensions, change of american monetary policies, the weakness in the US dollar, among other key factors have affected the quotes of the yellow metal.Can we expect more bullish moves, what do you think? will you go long or short this week?
Share with us your thoughts and choose the best trading account from FBS with minimum deposit of 1$ https://goo.gl/ps2Ntv

-
FBS Pro Contest is about to take off - are YOU in?
Join the challange NOW https://goo.gl/R1TdRN
Participate in next FBS Pro; trade on a demo account and win money prizes!
Simple easy steps, Zero-Risk trading :
ٌRegister your Demo Account until: 2018-04-02
Recieve a $10.000 demo account with leverage 1:100
The 5 best traders will get cash prizes of $1000
⌛ This contest will take place from 2018-04-02 to 2018-04-13

-
⚡PARTNERS⚡
FBS has the most rewarding affiliate program among the Forex brokers.
HOW CAN I OPEN A REPRESENTATIVE OFFICE OF FBS IN MY CITY?
Register a partner account in our company and start attracting clients. In the mean time, keep working on your own ideal business plan on opening a representative office in your city. As soon as you feel you are fully ready to present your model of development to us, please, contact our Partnership department. If you show solid results attracting new clients, you can also get an offer to open an office in your city from FBS representatives. Just try to impress us with your ability to promote our services!. Get your financial Freedom with FBS https://goo.gl/mzCn3e

-
USD/JPY Daily analytics
12:14 30.03.2018

The last 'Evening Star' and 'High Wave' patterns led to the current decline. The main bearish target is the 34 Moving Average, which could be a starting point for another upward price movement.

There's a bearish 'Three Methods' pattern, but the price faced with support on the Moving Averages. In this case, we could have a local correction in the short term. Nevertheless, there's an opportunity to have another decline afterwards.
More:
-
EUR/USD Daily analytics
12:11 30.03.2018

There's an 'Inverted Hammer', which has been confirmed. So, the market is likely going to test the nearest resistance area, which could be a departure point for another decline.

The lower 'Window' acted as support, so there's a developing upward correction. Also, we've got a bullish 'Three Methods' pattern, so the pair is likely going to reach the closest resistance area in the coming hours.
More:
-
GBP/USD Daily analytics
09:46 30.03.2018

There's a 'V-Bottom', which has been formed on the 55 Moving Average. The main intraday target is the nearest resistance at 1.4144, which could be a departure point for a downward price movement towards the closest support 1.3982 - 1.3928.

We've got a 'Triple Bottom' pattern, so the market is likely going to reach the nearest resistance at 1.4133. If a pullback from this level forms afterwards, bears will probably try to achieve the next support at 1.4027 - 1.3982.
More:
-
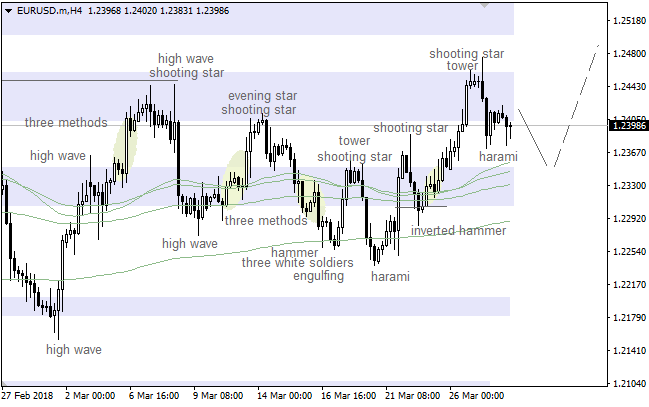
EUR/USD Daily Analytics
09:44 30.03.2018

There's a 'V-Bottom' pattern, so the price is testing the 89 Moving Average. If this line turns out to be broken, we should keep an eye on the nearest resistance at 1.2359 - 1.2372 as an intraday target. A pullback from this area could be a departure point for another decline towards the next support at 1.2272 - 1.2250.

The price has been rising since a 'Double Bottom' formed at the last low. It's likely that the pair is going to test the closest resistance at 1.2359 - 1.2372 in the coming hours. Meanwhile, if a pullback from these levels happens little later on, there'll be an opportunity to have a decline in the direction of another support at 1.2285 - 1.2272.
More:
-
EUR/GBP Daily Analytics
08:07 30.03.2018
Recommendation:
SELL 0.882 SL 0.8875 TP1 0.8735 TP2 0.867 TP3 0.845
SELL 0.8855 SL 0.891 TP1 0.8755 TP2 0.867 TP3 0.845
On the daily chart, EUR/GBP keeps medium-term consolidation in the 0.8700-0.9015 range in line with the “Spike and ledge” pattern. A break of its lower border will create grounds for the decline to 200% of AB=CD.

On H1, the “Shark” pattern is transforming into 5-0 after the pair reached 88.6% target of the former. Pullbacks towards 50% and 61.8% of the wave CD are usually used for selling.

More:
-
EUR/USD Daily analytics
07:28 30.03.2018
Recommendation:
SELL 1.2245
SL 1.2300
TP1 1.2095 TP2 1.2050 TP3 1.1965
On the daily chart, EUR/USD may form a unique chart pattern: a wedge inside a wedge. Point 5 of the junior pattern “Widening wedge” corresponds to 23.6% of the senior pattern’s wave 4-5. This creates a powerful entry point on the break of support at 1.2245-1.2250.

On H1 of EUR/USD, there’s a combination of “Spike and ledge” and “Widening wedge”. A break of the lower border of the consolidation range 1.2245-1.2445 will increase the possibility of a “Gartley” pattern.

More:
-
GBP/USD Daily analytics
06:53 30.03.2018
Technical levels: support – 1.3990; resistance – 1.4090.
Trade recommendations:
Buy — 1.3990; SL — 1.3970; TP1 — 1.4155; TP2 — 1.4225.
Reason: bullish Ichimoku Cloud, but the lines Senkou Span A and B are horizontal; a correctional dead cross of Tenkan-sen and Kijun-sen; the prices entered inside a Cloud and can test the support of Senkou Span B.

More:
-
EUR/USD Daily Analytics
06:52 30.03.2018
Technical levels: support – 1.2300; resistance – 1.2380.
Trade recommendations:
Buy — 1.2310/20; SL — 1.2290; TP1 — 1.2380; TP2 — 1.2420
Reason: narrowing bullish Ichimoku Cloud with falling Senkou Span A; a correctional dead cross of Tenkan-sen and Kijun-sen with the falling Tenkan-sen; the market had corrected to the Cloud and keep staying on its support.

More:
-
Important Trading Changes for March 30th, 2018
Check out the trading schedule for March 30th and plan your trading accordingly.

-
Why to join FBS affiliate program?
Actually, the real question is why not?
Our partnership program will be a real revolution of your income;
☑ Profit without risks and investments even if you are not a trader.
☑ Get commission up to $80 per each lot traded by your client.
☑ Non limited earnings - the more active you are, the more money you make.
Get your partner link NOW

-
POSITION SIZE, LEVEL OF RISK
Risk management is one of the most important knowledge on trading. Learn in this article how to calculate your position size, establish where the stop loss will be and more. https://goo.gl/iFr9YW

-
BITCOIN (BTC/USD): STRONG BIDS PLACED AROUND 7,586
18:36 28.03.2018
More:
Bitcoin continues to find support above the 7586 level, where buyers are actively concentrated and trying to resume the upward bias in the short term. Currently, there is a slight consolidation below the 50-hour moving average, which suggests that the current formation is that of a bearish pattern.
In Denmark, Danske Bank has announced that it will prohibit the trading of cryptocurrencies on its platforms, although they will still allow credit card transactions to customers in general. In addition, a regulated entity of the United States has sent a reminder to its members to report all activities that concern cryptocurrency.
The Parabolic SAR continues in favor of the bulls, although we are observing that this indicator is showing signs of weakness for the short term. The resistance of 8041 continues being an important barrier to face, reason why the rupture of the level of 7586 will be key to determine the following way of the BTC.
What do we expect?
According to our forecasts in the short-term, the BTC/USD pair aims to enter a consolidation stage above 7586, so that buyers could help push upwards towards the 200-hour moving average as the first objective. However, if such support comes to cede, the Bitcoin could rush to the level of 7068.

-
GOLD (XAU/USD) ENDING A POSSIBLE CORRECTIVE MOVE
18:40 28.03.2018
More:
Gold has been trading in a bearish tone below the 50 SMA at H1 chart following the US GDP data release during March 28th session. Currently, we’re seeing a corrective move to take place in favor of the overall bullish structure and if the XAU/USD pair touches the 65% Fibonacci level at 1324, it could gather momentum to resume the bullish bias towards the -23.6% Fibonacci area at 1368.
RSI indicator is in the oversold territory, calling for an imminent rebound.

-
USD/JPY Daily Analytics
14:33 28.03.2018

The price has been rising since a 'High Wave' pattern formed at the last low. However, if the 89 Moving Average acts as resistance, there'll be a moment for another decline.

The last 'Harami' pattern led to the current upward price movement. If any reversal pattern forms in the coming hours, there'll be an opportunity to have a bearish correction. Nevertheless, the pair is likely going to test the upper 'Window' afterwards.
More:
-
EUR/USD Daily Analytics
14:29 28.03.2018
The last bullish 'Harami' hasn't been confirmed because all the last candles are bearish. So, the market is likely going to test the Moving Averages, which could be a departure point for another upward price movement.

There's a bullish 'Hammer', which has been formed on the 55 Moving Average. However, confirmation of this pattern is quite weak. So, after a short break, bears are likely going to test the 144 Moving Average.
More:
-
GBP/USD Daily Analytics
09:36 28.03.2018

The main trend is still bullish, but there's a 'Double Top' pattern. In this case, we should keep on track the nearest support at 1.4027. If a pullback from this area happens little later on, there'll be a moment for an upward price movement towards another resistance at 1.4217 - 1.4277.

There's a 'V-Top' pattern, so the price is likely going to test the closest support at 1.4075 - 1.4064. If we see a pullback from these levels, bulls will probably try to reach the next resistance area at 1.4217 - 1.4243.
More:
-
EUR/USD Daily Analytics
09:34 28.03.2018

There's a 'Double Top' pattern, so the price is declining. In this case, the market is likely going to test the Moving Averages, which could be a departure point for another upward price movement.

The price is testing the 55 Moving Average. Considering the last 'Pennant' pattern, the pair is likely going to test the nearest support area at 1.2348 - 1.2331. If a pullback from this area happens little later on, there'll be a moment for a bullish price movement in the direction of the next resistance at 1.2445 - 1.2476.
More:
-
USD/CHF Daily Analytics
07:37 28.03.2018
Recommendations:
BUY 0.951 SL 0.9455 TP1 0.961 TP2 0.9715 TP3 0.986
SELL 0.9435 SL 0.949 TP1 0.936 TP2 0.9335 TP3 0.927
On the daily chart of USD/CHF, the pair needs to break the March high to continue rising. On the contrary, an implementation of the “three Indians” pattern will increase risks of a long-term bearish trend.

On H1, there is a short-term consolidation in the range of 0.9435-0.951. If bulls manage to break its upper boundary, the rally will continue. Vice versa, the break of the support at 0.9435 will increase risks of decline to the 88.6% target of the “Shark” pattern.

More:
-
GBP/USD Daily analytics
07:07 28.03.2018
Recommendation:
BUY 1.4245
SL 1.419
TP1 1.4345 TP2 1.4430 TP3 1.4525
On the daily chart, GBP/USD after reaching 88.6% target of the senior “Shark” pattern can proceed to 23.6%, 38.2% and 50% of the wave CD. To continue rally towards targets to 113% and 127.2% of the senior “Shark” pattern and AB=CD bulls need to rise above March high.

On H1, GBP/USD reached targets of a “Shark” and “Wolfe waves”. Further dynamics will depend on the pair’s exit of the 1.4065-1.4245 consolidation range.

More:
-
GBP/USD Daily Analytics
07:02 28.03.2018
Technical levels: support – 1.4150; resistance – 1.4200, 1.4250.
Trade recommendations:
Buy — 1.4160/70; SL — 1.4150; TP1 — 1.4250; TP2 — 1.4290.
Reason: bullish Ichimoku Cloud, but the lines Senkou Span A and B are horizontal; a golden cross of Tenkan-sen and Kijun-sen was cancelled, but the prices above the strong support of the lines.

More:
-
EUR/USD Daily Analytics
07:00 28.03.2018
Technical levels: support – 1.2380; resistance – 1.2450, 1.2520.
Trade recommendations:
Buy — 1.2400; SL — 1.2380; TP1 — 1.2450; TP2 — 1.2520
Reason: expanding bullish Ichimoku Cloud with rising Senkou Span A; a golden cross of Tenkan-sen and Kijun-sen with the rising Tenkan-sen; the prices are corrected to Kijun-sen and on the support of the line.

More:
FBS.com - Daily/Weekly Analysis / Market News
in Technical Analysis
Posted