Exchange Blog Cryptocurrency Blog


riki143
-
Posts
6,870 -
Joined
-
Last visited
Posts posted by riki143
-
-
FOREX BOOKS
50 PIPS A DAY FOREX STRATEGY
In this book, Laurentio Damir teaches the way to construct a reliable forex trading system, with the essential forex trading tools and how to apply solid money management rules and how to avoid making trading mistakes.
With a very simple to follow forex trading strategy to get 50 pips per day or more. It is ideal for beginner traders, but it will give a great deal of help to more experienced traders that have not found a clear strategy to make profits consistently.Easy to understand and to put into practice with very well defined entry, stop loss and exit levels.
Trade on FOREX with FBS with the best trading accounts options

-
Now it's more convenient and easier to attract customers!
Our promo materials work great, it's proven by thousands of our partners!
Become an FBS partner now and try it yourself - we are sure you will be surprised by how fast your income increases.
All these can be completed in five steps
1 Select a poster (by type, language and subject)
2 Copy the code with the reference link.
3 Place your poster on your site, your blog, or your forums.
4⃣ Monitor how fast your customer is growing
5⃣ Get the greatest profit ever!
Let's collaborate and make big money together!

-
US Nonfarm Payrolls
When we talk about the most important economic indicators, one of the first is the US nonfarm payrolls, also known as NFP. Job creation is a leading indicator of consumer spending, which accounts for the majority of the overall economic activity.
The data is released the first Friday of every month, and this time it will be on April 6. If the actual figure is higher than the forecast one, the greenback will have chances to strengthen. Note that the United States will also release the unemployment rate and average hourly earnings.
Follow these events on the FBS economic Calendar https://goo.gl/BCfsrG

-
Time to trade with CFD OIL! ⚫
Did you check FBS economic calendar?
Crude Oil Inventories will be announced at 17:30 MT time today. Set your strategy well not to miss this opportunity!

-
FOREX TRADING STRATEGY OZ: 100-800 PIPS PER TRADE
A powerful and very profitable trading strategy with a bit odd name. Follow the key ingredients and tell us about your results. Read the details here https://goo.gl/pwEvqG

-
EUR/GBP Daily Analytics
07:40 06.04.2018
Recommendation:
SELL 0.8715
SL 0.8770
TP1 0.8615 TP2 0.8590
On the daily chart, EUR/GBP keeps forming a 5-0 pattern. After a pullback to 38.2% of the wave CD of the “Shark” pattern, the initiative returned to bears. At the moment, the inside bars are formed. They point at uncertainty.

On H1, EUR/GBP is consolidating in the 0.8715-0.8755 range. A break of its lower border will create grounds for a “Crab” pattern with a target of 161.8%. On the other hand, successful test of resistance at 0.8755 will increase the risks of a correction.

More:
-
EUR/USD Daily Analytics
07:30 06.04.2018
Recommendation:
SELL 1.2315 SL 1.237 TP1 1.2215 TP2 1.2095 TP3 1.205
SELL 1.2215 SL 1.227 TP1 1.2115 TP2 1.2095 TP3 1.205
On the daily chart of EUR/USD, bears made the first attempt to pull the pair below support at 1.2245. As a result, it formed the junior pattern “Widening wedge”. To continue the decline the pair has to fall below April minimum.

On H1, there’s a “Widening wedge”. Pullbacks to 23.8%, 38.2% and 50% as usually are used for selling with targets at 78.6% of the Gartley pattern. At the same time, advance above 1.2417 will increase the odds of uptrend’s resumption.

More:
-
USD/JPY Daily Analytics
07:07 06.04.2018
Technical levels: support – 106.80; resistance – 107.50.
Trade recommendations:
Sell — 107.50; SL — 107.70; TP1 — 106.80; TP2 — 106.30.
Reason: bullish Ichimoku Cloud with horizontal Senkou Span A and B; a golden cross of Tenkan-sen and Kijun-sen, but the lines are horizontal; the market is overbought and under the strong daily resistance.

More:
-
AUD/USD Daily Analytics
07:05 06.04.2018
Technical levels: support – 0.7610, 0.7660; resistance – 0.7690
Trade recommendations:
Sell — 0.7650; SL — 0.7670; TP1 — 0.7580; TP2 — 0.7530.
Reason: expanding bearish Ichimoku Cloud with falling Senkou Span A; a golden cross of Tenkan-sen and Kijun-sen, but the prices are had entered into the negative area.

More:
-
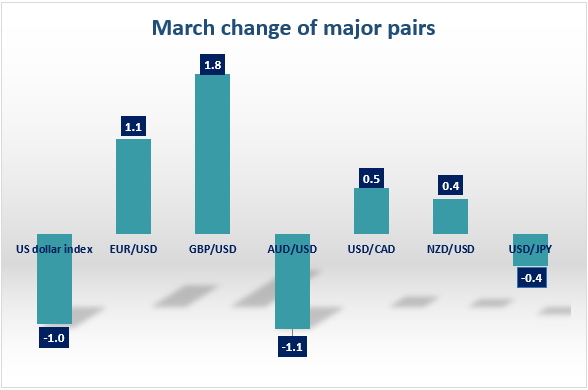
APRIL OUTLOOK ON THE FX MARKET
15:06 05.04.2018
Trade wars tensions are creating a high volatility in the FX market. Risk-on and risk-off sentiments make currencies rise and fall. However, not only trade wars affect the market. There are a lot of events that will support and weight on currencies this month.
We offer you a short outlook on April events.
USD
US steel and aluminum tariffs exacerbate further what are already tense ties between markets. The US tariffs met retaliations from other countries. For example, China enacted charges on 128 US goods. As a result, tensions between two largest world’s economies put pressure not only on the US dollar and Chinese yuan but also on the Australian dollar, Canadian dollar and Japanese yen.
The US dollar had been suffering from volatility for the previous month.
Besides trade wars issue, NAFTA negotiations were a driver of the greenback’s movement.
According to talks, Mr. Trump plans to agree on a previous version of the new NAFTA agreement to the middle of April. If negotiations are successful, it will support not only the greenback but Canadian dollar too. Pay attention to the Eighth Summit of the Americas that will be held on April 13 and 14, 2018. There is a high possibility that NAFTA parties will discuss the agreement there.
As you know, the Fed raised an interest rate in March. To assess a result of that decision, investors will look at inflation data (CPI m/m and Core CPI m/m on April 11 at 15:30 MT time). The Fed is anticipated to lift the interest rate at least 2 times this year, so the CPI figures will display if there is any reason to increase it to 3 times.
JPY
In March Haruhiko Kuroda was reappointed as the BOJ Governor. Mr. Kuroda is famous for his dovish policy. As a natural result, the Bank of Japan is anticipated to keep an interest rate on hold, that puts pressure on the yen.
Last month the USD/JPY pair fell to 104.625, so the yen reached new highs that is not good for the Japanese economy. Tankan manufacturing index and non-manufacturing index data appeared to be weaker for the first time in two years. Large Japanese manufacturers displayed a concern because of the strong yen as it negatively affects manufacturers.
An important event for this month is the BOJ policy rate on April 27. The possibility of the rate hike is still low as firstly the central bank has to taper its quantitative easing policy. However, the Governor may give some clues on the future monetary policy.
EUR
Trade wars covered not only Chinese and American economies but the European as well. After Trump’s move, the European Union claimed that it is going to impose 25% tariffs on $3.5 billion of American goods. So the previous month was risky for the euro.
The beginning of a new quarter appeared to be difficult for the European currency as well.
The European central bank has hinted on the soon quantitative easing tapering. Let’s look at the interest rate announcement on April 26 at 14:45 MT time. Mario Draghi may give prompts on the monetary policy.
GBP
The pound is showing good results. The UK currency managed to rise based on the positive economic data. However, March was not easy for the currency. Its rate highly depended on the Brexit negotiations. This month will not be an exclusion. If parties find areas of common interest, talks could start.
AUD
In March the Australian dollar plunged to the level of December 2017. The beginning of April is quite positive for the aussie but as you know, a positive trend cannot continue forever. Rate hikes always support domestic currencies. However, as we know the Reserve Bank of Australia does not plan to raise the interest rate until the end of 2018 that can have a negative impact on the aussie.
The RBA explains its decision at the meeting minutes. Follow monetary policy meeting minutes on April 17 at16:30 MT time.
Moreover, the Australian inflation is still below its target of 2-3%. Let’s look at the CPI q/q on April 24 at 4:30 MT time.
NZD
The New Zealand dollar tightly correlated with the US dollar and the Australian dollar.
The second quarter of this year began on a positive note for the New Zealand dollar. This month we do not anticipate a lot of crucial data from New Zealand. However, to predict the kiwi’s direction, you should pay attention to the US economic data. Moreover, follow trade wars news to predict the kiwi’s movement.
CAD
The environment of uncertainty around NAFTA negotiations affected the Canadian dollar. Canada was excluded from the US tariffs, however, it could not prevent the loonie from volatility. If NAFTA’s parties hammer out a deal this month, trade wars tensions will decline, the Canadian dollar will be able to rise.
Canada is one of the top oil producers in the world. So the loonie highly depends on the oil prices. When oil prices go up, the Canadian dollar rises. The OPEC and its allies are trying to control the oil output, however, US crude oil inventories put pressure on the oil market. As soon as the amount of US producers rise, the oil prices decline. The continuation of such rise will negatively affect the market and the Canadian dollar too.
There is a low chance that the Bank of Canada will increase the interest rate this month, however, Governor’s comments are highly important. Look at the BOC monetary policy report at 17:00 MT time on April 18.
Making a conclusion, we highly recommend you to follow the trade wars news to get ideas of the general currencies movement. Furthermore, do not forget about economic data that are crucial for your fundamental analysis.
Extra: monthly change of the major currency pairs
More:
-
USD/JPY Daily Analytics
13:53 05.04.2018

The last bullish 'Hammer' led to the current upward price movement. However, if we have a pullback from the nearest resistance area, there'll be time for a bearish correction towards the Moving Averages.

There's a 'Gravestone Doji', which has been formed at the last local high. Meanwhile, if a pullback from the closest support forms in the coming hours, bulls are likely going to deliver a new local high.
More:
-
EUR/USD Daily Analyics
13:49 05.04.2018
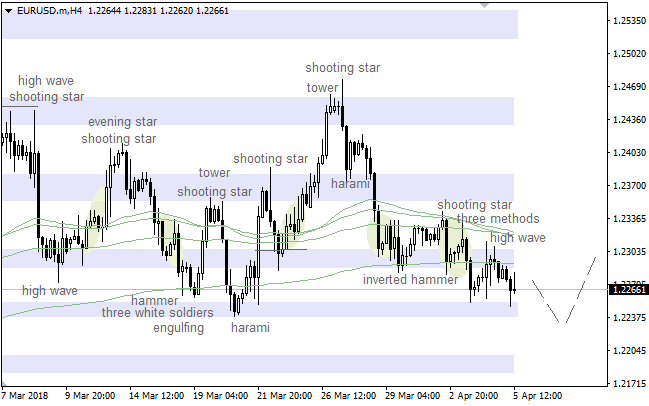
There's still no any reversal pattern so far, which means the pair is likely going to continue declining. However, if a pullback from the nearest support area forms little later on, there'll be an opportunity to have an upward correction.
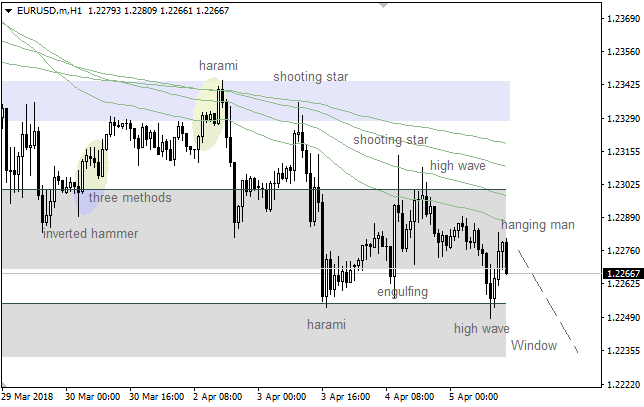
We've got a bearish 'Engulfing' pattern, which has been confirmed. So, the market is likely going to continue declining in the direction of the lower 'Window'.
More:
-
GBP/USD Daily Analytics
10:12 05.04.2018

The price is consolidating between the 34 & 55 Moving Averages. Also, there's a 'Flag' pattern, so the pair is likely going to test the closest support at 1.3982 - 1.3228. Meanwhile, if a pullback from this area forms little later on, there'll be a moment for an upward price movement in the direction of the next resistance at 1.4096 - 1.4144.

There's a consolidation, which is taking place between the levels 1.4010 - 1.4096. It's likely that the pair is going to test the nearest resistance at 1.4069 - 1.4096. A pullback from these levels could be a starting point for a bearish price movement towards another support at 1.4027 - 1.4010.
More:
-
EUR/USD Daily Analytics
10:09 05.04.2018

Bears faced with support at 1.2250, so the pair is consolidating. The main intraday target is the next support at 1.2239, which could be a departure point for another upward price movement towards the nearest resistance at 1.2285 - 1.2335.

There's a 'V-Bottom', so the market is likely going to reach the 55 Moving Average. However, if this line acts as resistance, bears will probably try to test the closest support at 1.2233.
More:
-
USD/JPY Daily Analytics
07:48 05.04.2018
Recommendations:
BUY 107.00
SL 106.45
TP1 107.85 TP2 108
On the daily chart of USD/JPY, after the pair reached the 127.2% target of the “AB=CD” pattern there is a correction to the downtrend. Bulls are trying to implement the “Wolfe waves” pattern and push the pair at least to the resistance at 108 (23.8% from the long-term bearish wave).

On H1, if the pair hits the resistance at 107, the “AB=CD” pattern with the 161.8% target will be implemented and odds of the rise to targets of “Shark” (113%) and “Wolfe waves” patterns will increase.

More:
-
USD/CHF Daily Analytics
07:45 05.04.2018
Recommendations:
BUY 0.958
SL 0.9525
TP1 0.968 TP2 0.974 TP3 0.979
On the daily chart of USD/CHF, bulls managed to push the pair out of the long-term downtrend channel and implement the “AB=CD” pattern with the 224% target. To continue the rally, the pair should break the resistance at 0.9811.

On H1, the “Spike and reversal with acceleration” pattern is implemented. The bullish trend will continue until the pair falls below the bottom boundary of the uptrend. Pullbacks to supports at 0.958 and 0.9555 may be used for long positions.

More:
-
GBP/USD Daily Analytics
07:37 05.04.2018
Technical levels: support – 1.4040/50; resistance – 1.4140.
Trade recommendations:
Buy — 1.4060; SL — 1.4040; TP1 — 1.4140; TP2 — 1.4170.
Reason: bullish Ichimoku Cloud with horizontal Senkou Span A and B; a weak golden cross of Tenkan-sen and Kijun-sen with horizontal lines; the prices are on the support of Kijun-sen.

More:
-
EUR/USD Daily Analytics
07:35 05.04.2018
Technical levels: support – 1.2150, 1.2250; resistance – 1.2300.
Trade recommendations:
Sell — 1.2240; SL — 1.2260; TP1 — 1.2180; TP2 — 1.2150
Reason: expanding bearish Ichimoku Cloud with falling Senkou Span A; a new dead cross of Tenkan-sen and Kijun-sen with the falling Tenkan-sen and Kijun-sen; the market returned to 3-W lows again.

More:
-
EUR/JPY Daily Analytics
06:38 05.04.2018
Recommendation:
BUY 131.80
SL 131.25
TP1 132.80 TP2 133.20 TP3 136.70
On H1, EUR/JPY is consolidating in the 129.15-132.15 range within the “Spike and ledge” pattern. A break of its upper border will increase the risks of a “Shark” pattern with a target at 88.6%. It corresponds to 136.7.

On H1 of EUR/JPY, the inability of bears to return the pair inside the downtrend channel points at their weakness. A successful test of resistance at 131.8 will open the way up to targets of “Wolfe waves” and “Shark”.

More:
-
USD/JPY Daily Analytics
12:41 04.04.2018

There's a bearish 'Tower' pattern, which has been confirmed. Therefore, the market is likely going to test the nearest support once again. A pullback from this area could be a starting point for an upward price movement.

We've got a bearish 'Engulfing' and 'Harami' patterns, so the pair is declining. It's likely that the price is going to reach the next support area in the coming hours.
More:
-
GBP/USD Daily Analytics
11:36 04.04.2018

The main trend is still bullish, but the market is consolidating along the Moving Averages. It's likely that the pair is going to test the next resistance at 1.4144. However, if a pullback from this level happens little later on, there'll be a moment for a decline towards the 89 Moving Average.

The price is consolidating between the levels 1.3982 - 1.4095. The main intraday target is the closest support at 1.4049 - 1.4027, which could be a starting point for a bullish price movement in the direction of the next resistance at 1.4133 - 1.4144
More:
-
EUR/USD Daily Analytics
11:34 04.04.2018

There's a 'Double Bottom' pattern, but the price remains under the Moving Averages. The main intraday target is the nearest resistance at 1.2335 - 1.2344, which could be a departure point for another decline.

The 55 Moving Average acted as resistance, so there's a 'Thorn' pattern. In this case, the pair is likely going to test the closest support at 1.2272 - 1.2253. If we have a pullback from this area, there'll be a moment for an upward price movement.
More:
-
XAU/USD Daily Analytics
09:25 04.04.2018
Recommendations:
BUY 1345
SL 1330
TP1 1374 TP2 1394
On the daily chart of XAU/USD, bears are trying to form the “Shakeout-Fakeout” pattern as the pair could not break the upper boundary of 1302-1340 consolidation. To implement it the pair has to break the support at 1321. Vice versa, the hit of resistances at 1340 and 1345 will let bulls to hope on the continuation of the rally to 113% and 127.2% targets of “Shark” and “AB=CD” patterns.

On H1, the implementation of the “Butterfly” pattern will increase risks of the sharp decline. To resume the uptrend bulls should break the resistance at 1345.

More:
-
GBP/USD Daily Analytics
09:22 04.04.2018
Recommendations:
BUY 1.4195
SL 1.414
TP1 1.4295 TP2 1.443 TP3 1.4515
On the daily chart of GBP/USD, a correction within the “Shark” pattern’s transformation to 5-0 ended at the level of 38.2% from the CD wave. To resume the uptrend bulls should break the resistance at 1.4122. As a result, odds of 113% and 127.2% targets of “Shark” and “AB=CD” patterns will increase.

On H1, after the pair reached the first target of the “Wolfe waves” pattern a natural pullback happened. To continue the rally, bulls should break the resistance at 1.4195.

More:
FBS.com - Daily/Weekly Analysis / Market News
in Technical Analysis
Posted