Exchange Blog Cryptocurrency Blog


TifiaFX
-
Posts
621 -
Joined
-
Last visited
-
Days Won
4
Everything posted by TifiaFX
-
AUD/USD: Current Dynamics 11/26/2019 AUD / USD remains in a long-term downtrend. Disappointing data from the Australian labor market, according to which unemployment rose in October by 0.1%, contributed to a sharp weakening of the Australian dollar and the fall of the pair AUD / USD. OsMA and Stochastic indicators on the weekly and daily charts are on the side of sellers. In case of further decline, the targets will be the support levels of 0.6670 (lows of 2019), 0.6600, 06570 (the lower line of the downward channel on the weekly chart). The distant target is located at support levels of 0.6260, 0.6000 (lows of 2008 - 2009). A signal for the development of an alternative scenario could be a breakdown of the resistance level 0.6802 (ЕМА200 on the 1-hour chart). However, the growth of AUD / USD will be limited by resistance levels of 0.6875 (ЕМА144 on the daily chart), 0.6920 (ЕМА200 on the daily chart). Despite the recent lower interest rates and lower income taxes, consumer confidence in Australia last week fell to its lowest level in more than four years. Consumers' assessment of the future prospects of the Australian economy is currently at the lowest level in the history of this survey. This year, Australia's central bank lowered its key interest rate three times (to the current record low of 0.75%), and markets expect another cut in early 2020. The next RBA meeting on monetary policy will be held next week. It will take place against the backdrop of rising unemployment (up to 5.3% in October), weak GDP growth and declining consumer confidence. If the RBA decides to lower the rate already at this meeting, then AUD is likely to fall under mass sales. RBA managing director Philip Lowe said today that if the key rate is lowered to 0.25%, the issue of quantitative easing will be considered. "There may come a time when quantitative easing will be necessary to support our collective well-being, but that moment has not come yet, and I hope that will not", Lowe said. “I hope that other options for state policy will also be included in the agenda”, he said. Thus, we should expect further weakening of AUD and the fall of the pair AUD / USD. Support Levels: 0.6745, 0.6700, 0.6670, 0.6600, 0.6300 Resistance Levels: 0.6802, 0.6820, 0.6875, 0.6920 Trading Recommendations Sell by market, Sell Limit 0.6800, 0.6820. Stop-Loss 0.6830. Take-Profit 0.6745, 0.6700, 0.6670, 0.6600, 0.6300 Buy Stop 0.6830. Stop-Loss 0.6770. Take-Profit 0.6870, 0.6900 *) For up-to-date and detailed analytics and news on the forex market visit Tifia Forex Broker website tifia.com
-
EUR/USD: the euro is vulnerable against the dollar 11/25/2019 Last Friday, the publication of positive US macro data for November supported the dollar. At the beginning of today's European session, DXY dollar index futures are trading at 98.19, 29 pips higher than the closing price last Thursday. The growth of PMIs for purchasing managers for the manufacturing and service sectors, as well as the consumer sentiment index also triggered a decline in demand for defensive assets - gold and government bonds, increasing the tendency of investors to buy risky assets of the US stock market. The final consumer sentiment index of the University of Michigan at the end of November amounted to 96.8 against the October level of 95.5, which is also higher than the forecast of 95.7. American consumers positively assess the prospects for the US economy, which still demonstrates greater stability in the context of international trade conflicts than the economy of other US partner countries. Due to concerns about the state of the Eurozone economy, the euro is unlikely to show significant growth against the US dollar in the near future. Today, regarding the dollar and the euro, the publication of important macro statistics is not planned. This week, investors will follow the publication on Thursday and Friday of inflation indices in Germany and the Eurozone. Meanwhile, EUR / USD continues to decline, trading below key resistance levels of 1.1125 (ЕМА144 on the daily chart), 1.1170 (ЕМА200 on the daily chart). A break into the zone below the local support level of 1.0995 (November lows) is likely to indicate a strengthening of the downward trend with targets at support levels of 1.0940, 1.0900. Any corrective growth of EUR / USD will be limited by resistance levels 1.1125, 1.1170. Long-term negative dynamics of EUR / USD remains. Short positions are preferred. Support Levels: 1.0995, 1.0940, 1.0900 Resistance Levels: 1.1053, 1.1060, 1.1110, 1.1125, 1.1175 Trading Recommendations Sell by market. Stop-Loss 1.1070. Take-Profit 1.0995, 1.0940, 1.0900 Buy Stop 1.1070. Stop-Loss 1.1010. Take-Profit 1.1110, 1.1125, 1.1175 [img]https://i.postimg.cc/T1PCkGTX/DXY.png[/img] [img]https://i.postimg.cc/wMbFZPBR/251119-EU-D.png[/img] [img]https://i.postimg.cc/mZddPcSZ/251119-EU-H1.png[/img] *) For up-to-date and detailed analytics and news on the forex market visit Tifia Forex Broker website tifia.com
-
Brent: near key resistance levels 11/22/2019 Against the backdrop of investor optimism regarding the imminent conclusion of a trade agreement between the United States and China, Brent crude prices rose in the past 2 months, exceeding $64.00 per barrel last Thursday. Nevertheless, the price has not yet been able to develop an upward trend above this mark, near which strong resistance levels 63.60 (EMA200 on the daily chart) and 63.90 (Fibonacci level 38.2% of the downward correction in the wave of price growth from a level near the level of 27.10 to highs of October 2018 near the mark of 86.60 dollars per barrel) are located. Currently, Brent crude is trading in the zone of these resistance levels, from which either a rebound or consolidation is possible. For further price movement in one direction or another, new drivers are needed. They may be trade negotiations between the US and China and the OPEC meeting in December. At the same time, OPEC’s decision to reduce oil production was mainly taken into account in prices, the level of oil production in the United States remains high, and there is no tangible progress in trade negotiations between the United States and China. These factors indicate that further growth in oil prices will be limited. On Friday, oil market participants will follow the publication (at 18:00 GMT) of the Baker Hughes report on the number of active drilling rigs in the United States. Previous reports showed a decrease in the number of active oil platforms in the United States to 674 units at the moment (from 800 units at the beginning of June and 742 units at the beginning of September). If the report again indicates a decrease in the number of such installations, then this may give a short-term positive impetus to prices. Nevertheless, to say that optimism of investors dominates the oil market is hardly appropriate. The global bearish trend in oil prices remains in force. Brent oil price decline into the zone below 61.80 (ЕМА200 on the 4-hour chart, ЕМА50 on the daily chart) will mean the resumption of a global downtrend with support at 60.40 (May lows), 58.50, 56.90 (Fibonacci level 50%). The first important signal for the resumption of sales will be the breakdown of support levels 63.00 (ЕМА144 on the daily chart), 62.45 (ЕМА200 on the 1-hour chart). In an alternative scenario, the resumption of growth and the breakdown of the local resistance level of 64.00 will strengthen the bullish momentum and direct the price to resistance levels of 66.10, 67.50. Further price increases are unlikely. Support Levels: 63.60, 63.00, 62.45, 61.80, 60.40, 58.50, 56.90 Resistance Levels: 64.00, 65.10, 67.50 Trading recommendations Sell by market. Stop-Loss 64.30. Take-Profit 63.00, 62.45, 61.80, 60.40, 58.50, 56.90 Buy Stop 64.30. Stop-Loss 62.90. Take-Profit 65.10, 67.00, 67.50 *) For up-to-date and detailed analytics and news on the forex market visit Tifia Forex Broker website tifia.com
-
EUR/USD: the Fed took a wait and see position 11/21/2019 The minutes published on Wednesday from the Fed meeting in October confirmed the central bank’s leadership’s attitude to take a wait-and-see attitude to determine if the economy will need additional stimulus in the coming months. "Most participants decided that monetary policy after lowering rates by a quarter percentage point at this meeting will be precisely tuned to maintain prospects for moderate economic growth, a strong labor market", the minutes said. The probability of the next one reduction in rates by the middle of next year, according to the CME Group, is about 50%. However, the dollar is falling on Thursday. At the start of today's European session, the DXY dollar index futures are trading near 97.70, 6 pips below today's open price and 13 pips below open price earlier this week. Now, participants in the financial market will follow the publication (at 12:30 GMT) of the minutes from the ECB meeting in October. If the protocols contain unexpected statements or new information regarding the prospects of monetary policy, this could lead to a surge in volatility in trading on the euro and on the European stock market. In October, the ECB did not change its monetary policy and announced no new measures. At the same time, among the Governing Council of the ECB, voices of opponents of the current incentive policy are increasingly heard. The next meeting of the ECB on monetary policy will be held on December 12, and any changes in the mood of the ECB leaders and their opinion on the current monetary policy of the central bank may lead to increased volatility in the financial markets, especially for the euro and EUR / USD. Currently, EUR / USD is developing an upward trend, trading above short-term support levels of 1.1065 (ЕМА200 on the 4-hour chart, ЕМА50 on the daily chart), 1.1060 (ЕМА200 on the 1-hour chart). Nevertheless, EUR / USD growth is above key resistance levels of 1.1130 (ЕМА144 on the daily chart), 1.1175 (ЕМА200 on the daily chart) is unlikely. In general, the long-term bearish trend of EUR / USD remains. The breakdown of the support level of 1.1060 will be a signal for the resumption of sales of EUR / USD. Support Levels: 1.1065, 1.1060, 1.0995, 1.0940, 1.0900 Resistance Levels: 1.1110, 1.1130, 1.1175 Trading Recommendations Sell Stop 1.1050. Stop-Loss 1.1110. Take-Profit 1.1000, 1.0940, 1.0900, 1.0850 Buy Stop 1.1095. Stop-Loss 1.1050. Take-Profit 1.1110, 1.1130, 1.1175 *) For up-to-date and detailed analytics and news on the forex market visit Tifia Forex Broker website tifia.com
-
USD/CAD: Current Dynamics 11/20/2019 In the first ten days of October, the USD / CAD pair broke through an important support level (EMA144, EMA200 on the daily chart), which at that time passed through the 1.3230 mark and reached a local minimum near the 1.3042 mark by the end of October. Nevertheless, there was no further decline of USD / CAD, and after the meeting of the Bank of Canada and the Fed, at which the Fed leaders announced the suspension of the rate reduction cycle, the US dollar began to strengthen, including in the USD / CAD pair. The long-term positive dynamics of the US dollar and, accordingly, the USD / CAD pair, which continues to trade above the key and long-term support level of 1.2920 (EMA200 on the weekly chart), remains. At the beginning of the European session, USD / CAD is trading above 1.3300 mark, developing an upward trend. While USD / CAD is trading in the zone above the support level of 1.3227 (EMA200 on the daily chart, EMA200 on the 1-hour chart), you should look for the opportunity to enter long positions. A signal for sales will be a breakdown of the support level of 1.3227. In this case, the reduction targets will be the support levels 1.3200, 1.3138 (September lows), 1.3100, 1.3060, 1.3042. From the news for today it is worth paying attention to the publication (at 13:30 GMT) of consumer price indices in Canada, as well as weekly data on oil reserves in the USA (at 15:30 GMT). Forecast for October: the consumer price index will come out with a value of +1.9% (in annual terms). Core CPI is also expected to increase by +1.9% in October. Data better than expected and above the previous values will strengthen the Canadian dollar. If the data for October is worse than the previous values, then this will negatively affect CAD. Also, CAD may be negatively affected by the publication of US Department of Energy data on oil reserves, which are expected to rise again last week (+1.1 million barrels). Pessimism over US-China trade relations is forcing investors to give up risk by raising demand for safe assets and the dollar, as well as putting pressure on commodity goods prices and commodity currencies, such as CAD. Oil prices are falling, as the stalled US-China trade negotiations causes worry about demand prospects. The overall decline in oil prices this week was already 4.7%. As Carolyn Wilkins, Bank of Canada Deputy Governor, said on Tuesday, “the risks for global GDP growth have intensified”, and “the uncertainty surrounding foreign trade remains heightened”. “We cannot afford to lose our vigilance”, she said, “especially when it comes to recession”. The next meeting of the Bank of Canada on the issue of monetary policy is scheduled for December 4. Volatility growth in the financial market today is also expected at 19:00 (GMT), when the minutes from the October meeting of the Fed will be published, especially if they contain unexpected information regarding the issue of monetary policy of the US central bank. Support Levels: 1.3300, 1.3270, 1.3227, 1.3200, 1.3138, 1.3100, 1.3060, 1.3042, 1.3015 Resistance Levels: 1.3345, 1.3380, 1.3400, 1.3452 Trading Scenarios Sell Stop 1.3250. Stop-Loss 1.3320. Take-Profit 1.3227, 1.3200, 1.3138, 1.3100, 1.3060, 1.3042, 1.3015 Buy Stop 1.3320. Buy Limit 1.3270. Stop-Loss 1.3250. Take-Profit 1.3345, 1.3380, 1.3400, 1.3452 *) For up-to-date and detailed analytics and news on the forex market visit Tifia Forex Broker website tifia.com
-
NZD/USD: after the meeting of the RBNZ 19/11/2019 In the period after 14:00 (GMT), data from the milk auction will be published. Two weeks ago, the dairy price index prepared by Global Dairy Trade came out with a value of +3.7% (against the forecast of +1.9% and an increase of 0.5% in the previous 2-week period). A significant part of New Zealand exports is dairy products, primarily milk powder. The increase in world prices for dairy products provides additional support to the New Zealand economy, increasing the level of export foreign currency earnings. According to the forecast, it is expected that prices for dairy products rose again in the previous 2 weeks, and the price index will come out with a value of +1.6%. If the data coincides with the forecast or is better than it, then the New Zealand dollar will strengthen, including in the pair NZD / USD. Meanwhile, the US dollar remains vulnerable after weak data on US industrial production came out Friday, as well as reports that U.S. President Donald Trump and Fed Chairman Jerome Powell met on Monday to discuss economic issues, including the strengthening of the U.S. dollar. Trump later said after a 30-minute meeting with Powell that he had protested that the Fed’s rate was still too high compared to the interest rates of competing countries. In his opinion, the interest rate in the United States should be lower than in these countries. The New Zealand dollar resumed growth after last week the RBNZ unexpectedly did not change its policy and left the interest rate at 1.0%. At the beginning of the European session, NZD / USD is trading near 0.6410, 0.6420, continuing corrective growth in the upward channel on the daily chart. The upper boundary of this channel runs near the 0.6520 and EMA200 level on the daily chart. The upward correction of NZD / USD is likely to be limited by the resistance levels of 0.6465 (ЕМА144), 06520 (ЕМА200 on the daily chart). A breakdown of the support level of 0.6385 (EMA200 on the 1-hour chart) will be the first signal to resume sales of NZD / USD with targets at support levels of 0.6260, 0.6200, 0.6100. Support Levels: 0.6390, 0.6385, 0.6372, 0.6322, 0.6260, 0.6200, 0.6100 Resistance Levels: 0.6435, 0.6465, 0.6520 Trading Scenarios Sell Stop 0.6380. Stop-Loss 0.6425. Sell Limit 0.6465, 0.6520. Stop-Loss 0.6550. Take-Profit 0.6372, 0.6322, 0.6260, 0.6200, 0.6100 Buy Stop 0.6425. Stop-Loss 0.6380. Take-Profit 0.6435, 0.6465, 0.6520 *) For up-to-date and detailed analytics and news on the forex market visit Tifia Forex Broker website tifia.com
-
DJIA: Current Dynamics 11/18/2019 US stock indexes continue to grow and break new records, updating absolute highs. At the beginning of the European session on Monday, the S&P 500 is trading near the 3122.0 mark, and the Nasdaq100 is near the 8330.0 mark. Dow Jones Industrial Average broke through the resistance level of 28000.0, trading at the time of publication of the article near the mark of 28050.00. Investor enthusiasm stems from expectations of a trade agreement between the US and China. Investors continue to follow any comments by the US and Chinese authorities regarding trade negotiations. The deterioration of prospects in this direction may again bring down stock indices. The Fed’s propensity to maintain soft policy, as well as a revival of economic activity in the US, which is exceeded by expectations for GDP data for the 3rd quarter and the improvement of the American labor market in October, according to data presented at the beginning of the month, are also of positive importance for American stock indices. In an alternative scenario, the signal for DJIA sales will be a breakdown of the short-term support level of 27700.0 (ЕМА200 on the 1-hour chart). The immediate goal of the decline is located at the support level of 27250.0 (ЕМА200 on the 4-hour chart). In case of further decline, the targets will be the key support levels 26600.0 (ЕМА144 on the daily chart), 26400.0 (ЕМА200 on the daily chart). The breakdown of the support level of 26400.0 may provoke a further decrease to support levels of 25270.0 (August lows), an important support level of 25050.0 (Fibonacci level 23.6% of the correction to the DJIA growth wave, which began in February 2016 from 15500.0), 24600.0 (lows of June 2019). Nevertheless, the long-term positive dynamics of US stock indices remains. Long positions by DJIA are preferred. On Wednesday (at 19:00 GMT) the minutes of the October meeting of the Fed will be published, which may cause increased volatility in the financial markets if the protocol texts contain unexpected information regarding the prospects for monetary policy or the state of the US economy. Support Levels: 28000.0, 27700.0, 27400.0, 27250.0, 26900.0, 26600.0, 26400.0 Resistance Levels: 28100.0 Trading Scenarios Buy in the market. Stop-Loss 27680.0. Take-Profit 28100.0, 28500, 29000.0 Sell Stop 27680.0. Stop-Loss 28040.0. Take-Profit 27400.0, 27250.0, 26900.0, 26600.0, 26400.0 *) For up-to-date and detailed analytics and news on the forex market visit Tifia Forex Broker website tifia.com
-
Brent: short positions are preferred 11/15/2019 A report released on Thursday by the US Department of Energy indicated another increase in US oil reserves (+2.219 million barrels, with a forecast of +1.649 million barrels). US oil inventories rose to 449 million barrels and are still 3% above the 5-year average for this time of year. The EIA also reported an unexpected increase in gasoline inventories by 1.9 million barrels and an increase in US oil production by 200,000 barrels per day, to a new record high of 12.8 million barrels per day. The report indicates that US oil reserves continue to grow. This is the eighth consecutive week of oil reserves growth. Despite the negative data for oil quotes, the optimism of the oil market participants, which was associated with expectations of a trade agreement between the US and China, contributed to an increase in oil prices in the last 2 months. As announced earlier this month, the Ministry of Commerce of China, the parties agreed to abolish duties at the same time and in equal amounts if a trade agreement of the first phase is signed. Oil demand also grew thanks to growth in the global and US stock markets. All three major US stock indexes hit record highs thanks to a robust US labor market, hopes for a US-China trade dispute and a successful corporate reporting season. Nevertheless, trade disagreements between the US and China continue despite oral agreements that gave hope for a delay in the introduction of new duties, while US oil reserves are growing with rising production levels. These are negative factors for oil quotes. Baker Hughes report on the number of active drilling rigs in the USA, which will be presented at 18:00 (GMT), will be in the focus of attention of oil market participants on Friday. It will probably indicate a further slowdown in drilling operations in the United States, as the relatively low oil prices force some shale oil producers to temporarily slow down. Previous reports indicated a decrease in the number of active oil platforms in the United States. If the report again indicates a decrease in the number of such installations, then this may give a short-term positive impetus to prices. Nevertheless, it is still premature to talk about a change in the bearish trend of oil to bullish. The price could not develop an upward trend above 63.30. Above it, there is a key resistance level of 63.90 (EMA200 on the daily chart and a Fibonacci level 38.2% of the downward correction in the wave of price growth from a level near the level of 27.10 to the highs of October 2018 near the level of 86.60 dollars per barrel). And while the price is trading in the zone below this resistance level, short positions look preferable, which speaks in favor of resuming sales when local correction levels of resistance will be reached. The breakdown of the support level of 61.45 (EMA200 on the 4-hour chart, EMA50 on the daily chart) will mean the resumption of the global downtrend with support at 60.40 (May lows), 58.50, 56.90 (Fibonacci level of 50% and the middle of the downward channel on the daily chart). Support Levels: 61.45, 60.40, 58.50, 56.90 Resistance Levels: 62.20, 62.75, 63.30, 63.90 Trading Recommendations Sell by market, Sell Limit 62.75, 63.30, 63.90. Stop-Loss 64.10. Take-Profit 61.45, 60.40, 58.50, 56.90 Buy Stop 64.10. Stop-Loss 62.90. Take-Profit 65.10, 67.00, 68.00, 69.00 *) For up-to-date and detailed analytics and news on the forex market visit Tifia Forex Broker website tifia.com
-
AUD/USD: Current Dynamics 11/14/2019 Australia's labor market situation worsened last month. According to the Australian Bureau of Statistics, unemployment in Australia in October increased by 0.1% to 5.3%, while the number of jobs in Australia fell this month by 19,000 (the forecast assumed an increase of 17,000). Another negative factor for AUD was the weaker macro statistics from China, which is Australia's largest trade and economic partner, published during the Asian session. According to the National Bureau of Statistics, industrial production in China grew by 4.7% in October after rising by 5.8% in September (forecast was +5.2%). The data indicate a worsening of China's problems while the country's government is trying to regulate trade relations with the United States. Meanwhile, trade negotiations between the US and China have stalled on the issue of purchases of US agricultural products. RBA may again lower rates at the last meeting of the year on December 3. "Given the events in the world and evidence of the availability of free resources in the Australian economy, it would be reasonable to expect that Australia would need a long period of low interest rates to achieve full employment and inflation target", said RBA managing director Philip Lowe in a statement following the meeting Bank in November. He reiterated that the central bank was prepared to lower rates "if necessary". AUD / USD broke through the support levels of 0.6837 (EMA200 on the 4-hour chart), 0.6830 (lows of June 2019 and 2016) and reached the level of 0.6782 by the time this article was published, remaining in a long-term downtrend. In case of further decline, the targets will be the support levels of 0.6670 (lows of 2019), 0.6600, 06570 (the lower line of the downward channel on the weekly chart). In any case, the possible correctional growth of AUD / USD will be limited by the resistance levels of 0.6890 (ЕМА144 on the daily chart), 0.6935 (ЕМА200 on the daily chart). A negative trend prevails. Short positions are preferred. Support Levels: 0.6745, 0.6700, 0.6670, 0.6600, 0.6300 Resistance Levels: 0.6830, 0.6837, 0.6855, 0.6890, 0.6935 Trading Recommendations Sell by market, Sell Limit 0.6830, 0.6835. Stop-Loss 0.6860. Take-Profit 0.6745, 0.6700, 0.6670, 0.6600, 0.6300 Buy Stop 0.6860. Stop-Loss 0.6810. Take-Profit 0.6890, 0.6935 [img]https://i.postimg.cc/sX9qdgn7/141119-AU-D.png[/img] [img]https://i.postimg.cc/d1Kpxy9J/141119-AU-H4.png[/img] *) For up-to-date and detailed analytics and news on the forex market visit Tifia Forex Broker website tifia.com
-
GBP/USD: until December 12, trading in the range is most likely 11/13/2019 As the UK National Bureau of Statistics said on Wednesday, consumer prices rose 1.5% (on an annualized basis) in October after rising 1.7% in September. This represents the lowest annual increase in consumer prices since November 2016. According to other data presented earlier in the week, the volume of industrial production in the country in September fell by -0.3% (-1.4% in annual terms), production in the UK manufacturing industry also decreased in September (-0.4% m/m, -1.8% y/y), worse than economists forecast. However, the British economy has so far managed to avoid a recession. UK GDP in the 3rd quarter grew by 0.3% compared with the previous quarter after a decrease of 0.2% in the 2nd quarter. At the same time, annual GDP growth amounted to +1.0%, which is the lowest indicator since the 1st quarter of 2010. The data suggests that uncertainty about Brexit and a slowdown in global economic activity have a chilling effect on the growth of the British economy despite the fact that the likelihood of a hard Brexit scenario has declined. At the same time, leaders of the Bank of England last week signaled that they could raise interest rates a little in the coming years if the uncertainty surrounding Brexit weakened and global economic growth recovered. This is a positive factor for the pound. Bank of England executives believe that if after the December elections the parliament approves the agreement reached by the Prime Minister on Brexit, then in the next few years the economy will grow slowly, but steadily, supporting inflationary pressures. Recent polls show a significant gap between conservatives and the opposition Labor Party ahead of the December 12 election. A clear majority in parliament will allow Johnson to break the legislative impasse and pull Britain out of the EU. Thus, there is currently no reason to significantly reduce the pound. If the Conservative Party gains a parliamentary majority following the election results, and lawmakers then approve the Brexit plan proposed by Prime Minister Boris Johnson, then this is likely to be followed by a strengthening of the British pound. However, until December 12, the GBP / USD pair is likely to remain in the current range between the local levels of support 1.2765 and resistance 1.3000. Breakdown of the resistance level of 1.3000 may cause further growth of GBP / USD. Nevertheless, below resistance levels 1.3100 (ЕМА144 on the weekly chart), 1.3210 (Fibonacci level 23.6% of the correction to the GBP / USD decline in the wave that began in July 2014 near the level of 1.7200), 1.3370 (ЕМА200 on the weekly chart) GBP / USD global bearish trend remains valid. In case of breakdown of the support level of 1.2665, the aim of the reduction will be the support level of 1.2000 (2017 lows and the Fibonacci level 0%). Support Levels: 1.2765, 1.2665, 1.2620, 1.2470, 1.2400, 1.2200, 1.2175, 1.2150, 1.2100, 1.2000 Resistance Levels: 1.2900, 1.3000, 1.3100, 1.3210, 1.3370 Trading Scenarios Sell Stop 1.2755. Stop-Loss 1.2915. Take-Profit 1.2700, 1.2665, 1.2620, 1.2470, 1.2400, 1.2200, 1.2175, 1.2150, 1.2100, 1.2000 Buy Stop 1.2915. Stop-Loss 1.2820. Take-Profit 1.3000, 1.3100, 1.3210, 1.3370 *) For up-to-date and detailed analytics and news on the forex market visit Tifia Forex Broker website tifia.com
-
EUR/USD: negative dynamics of the pair remains 11/12/2019 Eurodollar could not develop an upward trend above the marks reached last month near the resistance level of 1.1180. The likelihood of a soon conclusion of a trade agreement between the United States and China has again declined, and market participants are waiting for Donald Trump to decide to impose 25% duties on the import of European cars and components for their assembly into the United States. Against the background of the ongoing US trade conflict with China, the introduction of these duties would become a significant aggravation of the global trade situation and would make an additional contribution to the slowdown of the global economy. In this situation, the role of the dollar as a defensive asset again comes to the fore. The US economy appears more resilient amid a general slowdown in the global economy. In the 1st quarter of 2019, US GDP growth amounted to 3.1% (in annual terms), in the 2nd - 2%, in the 3rd quarter - 1.9%. Now market participants will follow the publication on Thursday (at 07:00 and 10:00 GMT) of GDP data for Germany and the Eurozone. German GDP growth is expected to slow again (-0.1% after a similar fall in the 2nd quarter). An updated estimate of the Eurozone GDP for the 3rd quarter suggests an increase of 0.2% (+1.1% in annual terms). Despite the positive data, this is significantly lower than the growth rate of the American economy. Meanwhile, the DXY dollar index continues to grow. At the beginning of the European session, DXY dollar index futures were trading at 98.17, 20 pips above the opening price earlier this month. The growing yield of US government bonds is also supporting the dollar. So, the yield on 10-year US bonds is 1.938% at the time of writing, versus 1.691% at the beginning of the month. Thus, the EUR / USD pair will remain under pressure in the medium term. In general, below the key resistance level of 1.1180 (ЕМА200 on the daily chart), the long-term negative dynamics of EUR / USD remains, which speaks in favor of sales of this currency pair. Below the resistance level of 1.1070 (ЕМА200 on the 1-hour, 4-hour charts, ЕМА50 on the daily chart), only short positions should be considered. Support Levels: 1.1000, 1.0940, 1.0900, 1.0850 Resistance Levels: 1.1070, 1.1110, 1.1135, 1.1180 Trading Recommendations Sell by market. Stop-Loss 1.1050. Take-Profit 1.1000, 1.0940, 1.0900, 1.0850 Buy Stop 1.1080. Stop-Loss 1.1050. Take-Profit 1.1110, 1.1135, 1.1180 *) For up-to-date and detailed analytics and news on the forex market visit Tifia Forex Broker website tifia.com
-
NZD/USD: NZD dynamics on the eve of the RBNZ meeting 11/11/2019 On Wednesday, the next RBNZ meeting will take place, and the decision on rates will be published at 01:00 (GMT). In August, the RBNZ cut the rate at once by 50 bp to 1.00%, explaining this decision by the aggravation of the trade war between the US and China and the loss of momentum in the New Zealand economy. RBNZ executives are inclined to further soften monetary policy, believing that wage growth in the country remains weak, inflation expectations are falling, and low levels of business confidence indicate a slowdown in hiring and wage growth. It is widely expected that the rate will be reduced at this meeting by 0.25%, to the level of 0.75%. The RBNZ press conference will begin on Wednesday at 02:00 (GMT). Probably, the head of the RBNZ Adrian Orr will reaffirm the bank’s penchant for soft monetary policy, which will preserve the pressure on the New Zealand currency. New Zealand's export-oriented economy suffers greatly from a slowdown in the global economy and a decline in purchases of New Zealand products, including by China. Meanwhile, optimism and risk appetite of investors are gradually dying out. Although China announced an agreement to abolish duties, U.S. President Donald Trump said last Friday that the United States did not promise to abolish existing customs duties on Chinese goods. Meanwhile, the New Zealand dollar strengthened, and NZD / USD rose in the first half of today's trading day, rising to a short-term resistance level of 0.6372 (ЕМА200 on the 1-hour chart, ЕМА50 on the daily chart). Nevertheless, expectations of a lower interest rate of the RBNZ and the bank's propensity for soft policy will restrain NZD / USD and the New Zealand dollar from further growth. Below the resistance level of 0.6525 (EMA200 on the daily chart), short positions remain preferred. The breakdown of the local support level of 0.6322 will be a signal for resuming NZD / USD sales with the immediate target at 0.6260 (Fibonacci level 0% and minimums of the global wave of pair decline from the level of 0.8820). Support Levels: 0.6322, 0.6260, 0.6200, 0.6100 Resistance Levels: 0.6372, 0.6390, 0.6435, 0.6475, 0.6525 Trading Scenarios Sell by market. Stop-Loss 0.6410. Take-Profit 0.6322, 0.6300, 0.6260, 0.6200, 0.6100 Buy Stop 0.6410. Stop-Loss 0.6360. Take-Profit 0.6435, 0.6475, 0.6525 *) For up-to-date and detailed analytics and news on the forex market visit Tifia Forex Broker website tifia.com
-
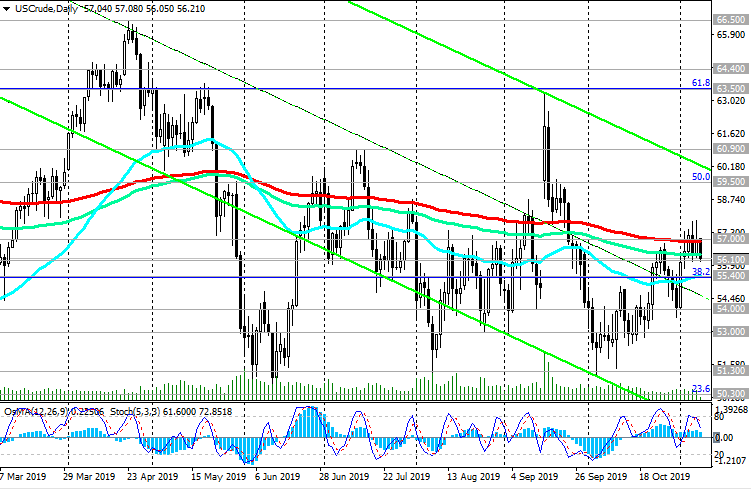
WTI Oil: upward correction is near completion 11/08/2019 Current Dynamics Despite a report by the US Department of Energy on Wednesday, which pointed to a significant increase in US oil reserves (+7.929 million barrels) last week, oil prices rose. The increase in prices was accompanied by an increase in the global and American stock markets. All three major US stock indexes hit record highs this week thanks to a robust US labor market, hopes for a US-China trade dispute resolving and a successful corporate reporting season. WTI oil prices rose this week to $ 57.80 per barrel (against $ 54.06 per barrel at the beginning of the month). Nevertheless, the optimism of investors is gradually dying away, and we again see a decline in oil prices. At the beginning of the European session, WTI crude oil is trading near 56.10. Despite verbal agreements that gave hope for a postponement of the introduction of new duties, and a statement by Chinese representatives about their readiness to remove all available duties, trade disagreements between the United States and China remain. The United States has not yet responded to a statement by the Chinese side about the readiness to remove all duties. The ongoing trade war between Beijing and Washington could again lead to lower oil demand. On Friday, oil market participants will pay attention to the publication (at 18:00 GMT) of the weekly report of the American oilfield services company Baker Hughes on the number of active drilling rigs in the United States. Previous reports showed a decrease in the number of active oil platforms in the United States to 691 units at the moment (from 800 units at the beginning of June and 742 units at the beginning of September). If the report again indicates a decrease in the number of such installations, then this may give a short-term positive impetus to prices. Nevertheless, talking about breaking the bearish trend of oil is still premature. The breakdown of the next important support level of 55.40 (EMA200 on the 4-hour chart, EMA50 on the daily chart, Fibonacci level 38.2% of the upward correction to the fall from the highs of the last few years near 76.80 to the support level near 42.15) will increase the pressure on the price towards its further reduction with a long-term goal at the support level of 42.15 (Fibonacci level of 0% and December 2018 lows). In the case of the resumption of positive dynamics in world stock indices and growth in the oil market, a breakdown of the local resistance level of 57.80 will strengthen the bullish momentum and direct the price to the resistance level of 60.90 (July highs) and further to the levels of 63.50, 64.40. In the meantime, a negative impulse prevails below the resistance level of 57.00; short positions are preferred. Support Levels: 55.40, 54.00, 53.00, 51.30, 50.30, 49.00, 42.15 Resistance Levels: 57.00, 57.80, 59.50, 60.90, 63.50, 64.40, 66.50 Trading Recommendations Sell Stop 55.90. Stop-Loss 56.70. Take-Profit 55.40, 54.00, 53.00, 51.30, 50.30, 49.00, 42.15 Buy Stop 56.70. Stop-Loss 55.90. Take-Profit 57.00, 57.80, 59.50, 60.90, 63.50, 64.40, 66.50 *) For up-to-date and detailed analytics and news on the forex market visit Tifia Forex Broker website tifia.com
-
XAU / USD: demand for protective assets decreased 11/07/2019 According to reports from the Ministry of Commerce of China at the beginning of today's European session, China and the United States have made significant headway towards a trade agreement by agreeing to abolish existing reciprocal duties. If the trade agreement of the first phase is signed, the duties will be canceled at the same time and in equal amounts. "The trade war began with an increase in duties and should end with the abolition of duties", said Gao Feng, a ministry spokesman, adding that "the time and place of signing the agreement has not yet been determined". This news caused a sharp increase in global stock indices and a drop in the quotes of gold and US government bonds. Thus, the yield on 10-year US bonds rose to 1.858%, compared to 1.814% at the beginning of today, and gold fell in price to 1482.00 dollars per ounce. Earlier this week, XAU / USD broke through the important short-term support level of 1497.00 (ЕМА200 on the 4-hour chart and on the 1-hour chart) and at the beginning of the European session on Thursday trying to gain a foothold in the zone below the support level of 1484.00 (Fibonacci level of 50% of the correction to the wave of decline since September 2011 and the mark of 1920.00). Despite the decline, XAU / USD maintains a long-term positive trend. Returning to the zone above the resistance level of 1497.00 will resume the bullish trend. In an alternative scenario and after the breakdown of the local support level of 1474.00 (the bottom line of the range between the levels of 1474.00 and 1520.00), XAU / USD will go to support levels of 1440.00 (ЕМА144 on the daily chart), 1410.00 (ЕМА200 on the daily chart). Breakdown of support levels of 1380.00 (Fibonacci level of 38.2% and highs of 2016), 1368.00 (highs of 2018) can cancel the bullish trend XAU / USD. Nevertheless, talking about breaking the bullish trend of gold is still premature. The tendency of world central banks to soft monetary policy, the upcoming British parliamentary elections on December 12, political instability in some EU countries, as well as a weakening dollar are important factors supporting demand on defensive assets, including gold. Support Levels: 1484.00, 1474.00, 1452.00, 1440.00, 1410.00, 1380.00, 1368.00, 1310.00, 1253.00 Resistance Levels: 1497.00, 1520.00, 1535.00, 1555.00, 1585.00 Trading Recommendations Sell Stop 1473.00. Stop-Loss 1498.00. Take-Profit 1452.00, 1440.00, 1410.00, 1380.00, 1368.00 Buy Stop 1498.00. Stop-Loss 1473.00. Take-Profit 1520.00, 1535.00, 1555.00, 1585.00, 1600.00 *) For up-to-date and detailed analytics and news on the forex market visit Tifia Forex Broker website tifia.com
-
GBP/USD: the pair is trading in a range before the meeting of the Bank of England 11/06/2019 The strengthening of the pound and the growth of the GBP / USD pair has stopped. Last month, amid the strengthening of the pound and the weakening dollar, the GBP / USD rose significantly, rising to the level of 1.3012, which corresponds to a 5-month high. The pound strengthened amid expectations of a trade agreement between the UK and the EU in connection with the country's exit from the block. Nevertheless, uncertainty about Brexit after the date postponement to January 31 remains, although the risk of a “hard” Brexit has decreased. On Thursday, a regular meeting of the Bank of England will be devoted to monetary policy issues. Probably, the Bank of England will not make changes to the current policy before the parliamentary elections scheduled for December 12th. The decision on the rate will be published on Thursday at 12:00 (GMT), and at 12:30 the head of the Bank of England Mark Carney will give a speech explaining the decision made by the bank and his vision of the prospects for the British economy. It is likely that neither the meeting of the Bank of England nor the speech of Mark Carney will make a significant change in the dynamics of the pound on the eve of the elections scheduled for December 12. The results of public opinion polls will be more important for the pound than the meeting and decisions of the bank and economic data. Meanwhile, quite positive macro data comes from the USA, including labor market data published last week. The US unemployment rate in September dropped to 3.5%, the lowest level for 50 years. Despite the slowdown, the labor market remains strong, reflecting the steady state of the US economy. The decision of the Fed leaders to lower the rate in October and their signals of intention not to change the current monetary policy so far have faded into the background. Positive macro statistics from the United States and investor propensity to buy US stock market assets will support the dollar. Despite significant correctional growth, GBP / USD is in a global downtrend, remaining traded in the zone below key resistance levels of 1.3100 (ЕМА144 on the weekly chart), 1.3210 (Fibonacci level 23.6% of the correction to the GBP / USD decline in the wave that started in July 2014, near the level of 1.7200), 1.3370 (EMA200 on the weekly chart). In a negative scenario, the return of GBP / USD to the zone below the support level of 1.2665 (EMA200 on the daily chart) will indicate a resumption of the bearish trend. The first signal to resume sales will be a breakdown of the local support level of 1.2800. In the case of the resumption of the bear trend, the long-term target of the decline will be the support level of 1.2000 (2017 lows and the Fibonacci level of 0%). To break the global bearish trend, GBP / USD should grow into a zone above the resistance levels 1.3210, 1.3370. Until December 12, when the British parliamentary elections will be held, GBP / USD will probably remain in the current range between 1.3000 and 1.2800, near the support level of 1.2885 (ЕМА200 on the 1-hour chart). Support Levels: 1.2885, 1.2800, 1.2685, 1.2665, 1.2600, 1.2470, 1.2400, 1.2200, 1.2175, 1.2150, 1.2100, 1.2000 Resistance Levels: 1.3000, 1.3100, 1.3210, 1.3370 Trading Recommendations Sell Stop 1.2785. Stop-Loss 1.2915. Take-Profit 1.2700, 1.2685, 1.2665, 1.2600, 1.2470, 1.2400, 1.2200, 1.2175, 1.2150, 1.2100, 1.2000 Buy Stop 1.3015. Stop-Loss 1.2870. Take-Profit 1.3100, 1.3210, 1.3370 *) For up-to-date and detailed analytics and news on the forex market visit Tifia Forex Broker website tifia.com
-
DJIA: trade negotiations support buyers 11/05/2019 In the middle of last month, DJIA again approached the level of absolute and annual highs near the level of 27400.0. However, for the breakdown of this level of resistance, the positive impulse was not enough and the DJIA fell again. Market participants continue to follow any comments by the US and Chinese authorities regarding trade negotiations. The deterioration of prospects in this direction may again bring down stock indices. Conversely, a warming or easing in trade disputes between the US and China will support stock indices. So, a new portion of positive information about the course of trade negotiations, which arrived at the beginning of this week, gave new strength to the bulls in the US stock market. As Myron Brilliant, Executive Vice President of the US Chamber of Commerce, said last Monday, "the parties have really come close to an agreement". There is also information that representatives of the United States and China are actively considering the abolition of some duties. Moreover, it is expected that the US-China trade agreement of the "first phase" will be signed in November. The Fed’s propensity to maintain soft policy, as well as the revival of economic activity in the US, which is signaled by exceeding expectations GDP data for the 3rd quarter and the improvement of the US labor market in October, according to data presented last week, are also of positive importance for American stock indices. Last Monday, the DJIA price broke through the resistance level of 27400.0 and rushed up, maintaining a positive trend, which speaks in favor of DJIA purchases. In an alternative scenario, after the breakdown of the short-term support level of 27150.0 (ЕМА200 on the 1-hour chart) and in case of resumption of decline, the targets will be support levels 26460.0 (ЕМА144 on the daily chart), 26260.0 (ЕМА200 on the daily chart). Above these support levels, there is the long-term positive dynamics of US stock indices and the DJIA index, including. From the news for today it is worth paying attention to the publication (at 15:00 GMT) of the index of business activity (ISM) in the US services sector, which assesses the state of the services sector in the economy. The growth rate and the result above 50 are considered as a positive factor for US stock indices. At the same time, a relative decrease in the indicator or data worse than the forecast may have a short-term negative impact on the US indices. Forecast: 53.4 in October (against 52.6 in September). Support Levels: 27400.0, 27150.0, 26900.0, 26700.0, 26460.0, 26260.0, 25270.0, 24600.0 Resistance Levels: 27600.0, 28000.0 Trading Scenarios Buy Stop 27610.0. Stop-Loss 27350.0. Take-Profit 28000.0 Sell Stop 27350.0. Stop-Loss 27610.0. Take-Profit 27150.0, 26900.0, 26700.0, 26460.0, 26260.0 [img]https://i.postimg.cc/kGzzLgDw/051119-DJIA-D.png[/img] [img]https://i.postimg.cc/gjn1MZcn/051119-DJIA-H1.png[/img] *) For up-to-date and detailed analytics and news on the forex market visit Tifia Forex Broker website tifia.com
-
AUD/USD: Current dynamics and recommendations 11/04/2019 Positive news about the US-China trade negotiations supported the Australian currency. The United States and China are Australia's largest trade and economic partners, and a positive shift in trade relations between the two countries has a positive effect on the mood of consumers and investors in the Australian economy. Meanwhile, a trade agreement could face an insurmountable obstacle. The US is demanding China’s commitment to buy US $ 50 billion worth of agricultural products be included in the trade agreement, which could be an obstacle to reaching that agreement. This is 2 times more than China bought before the conflict began. Purchases of this scale will far exceed the real needs of China and lead to a significant surplus in the domestic market, economists say. Another breakdown of the agreement between these countries could negatively affect both the world and Australian economies. On Tuesday (03:30 GMT), the decision on the rate will be made by the RB of Australia. In October, the RBA made the 3rd rate cut this year, bringing it to 0.75%. At the same time, the RBA leadership does not exclude the possibility of further easing of monetary policy. If tomorrow the RBA will lower the rate or directly declare such a reduction before the end of the year, then the Australian dollar runs the risk of falling under active sales. Also, in the dynamics of AUD, much will depend on the rhetoric of the accompanying RBA statement, which will also be published on Tuesday (at 03:30 GMT). At the beginning of the European session on Monday, AUD / USD is trading near 0.6910, remaining in a long-term downtrend, below the key resistance level of 0.6940 (ЕМА200 on the daily chart). The breakdown of the short-term support level of 0.6870 (EMA200 on the 1-hour chart) will be the first signal to resume sales of AUD / USD. In this case, the targets will be the support levels 0.6680, 0.6600. The immediate target is located at support levels of 0.6830 (ЕМА50 on the daily chart), 0.6820 (ЕМА200 on the 4-hour chart). In an alternative scenario, the correctional growth of AUD / USD will be limited by the resistance level of 0.6940. Support Levels: 0.6890, 0.6870, 0.6830, 0.6820, 0.6745, 0.6700, 0.6680, 0.6600, 0.6300 Resistance Levels: 0.6940 Trading Recommendations Sell by market, Sell Stop 0.6860. Stop-Loss 0.6950. 0.6830, 0.6820, 0.6745, 0.6700, 0.6680, 0.6600, 0.6300 *) For up-to-date and detailed analytics and news on the forex market visit Tifia Forex Broker website tifia.com
-
XAU/USD: Trading Scenarios 11/01/2019 The dollar is falling again, and gold is rising in price after the Fed meeting this week. As you know, the Fed again lowered the rate, for the third time this year, to the level of 1.75%, although it did not give clear signals aimed at further easing monetary policy. Market participants were also encouraged by the expectations of an early conclusion of a trade agreement between the United States and China. At the same time, investors fear that it may take longer than expected to conclude a trade agreement between the two countries that have the largest economies in the world, and disappointing macro data continues to come from various parts of the world with the world's largest economies. Today, market participants will focus on publishing data from the US labor market at 12:30 (GMT). US jobs are expected to grow by 89,000 in October, after rising 136,000 in September and 130,000 in August. If the US Department of Labor reports a significant increase in the number of jobs in October, observer concern about the possible impact of a slowdown in global economy for the US could weaken. However, if the report on the labor market coincides with the forecast or is worse than it, then this will further strengthen investors' doubts about the stability of the American economy in the context of international trade conflicts. This will be another reason for avoiding risks and buying protective assets, including gold. At the beginning of the European session on Friday, XAU / USD is trading above the important short-term support level of 1498.00 (EMA200 on the 4-hour chart and on the 1-hour chart) and above the support level at 1485.00 (Fibonacci level 50% of the correction to the wave of decline from September 2011 and mark 1920.00). The XAU / USD maintains long-term positive dynamics, and the fundamental background creates the prerequisites for maintaining demand for gold and further growth of XAU / USD towards long-term and absolute highs near the level of 1920.00 dollars per ounce. In an alternative scenario, the signal for sales will be a breakdown of the support levels of 1498.00 (EMA200 on the 4-hour chart and on the 1-hour chart), 1485.00 (Fibonacci level of 50% of the correction to the decline wave from September 2011 and the mark of 1920.00). In this case, a decline of the XAU / USD to support levels of 1408.00 (EMA200 on the daily chart), 1380.00 (Fibonacci level of 38.2% and highs of 2016), 1368.00 (highs of 2018) is possible. Nevertheless, a positive impulse and a tendency to further growth of XAU / USD prevail so far. Above the support levels of 1498.00, 1485.00, long positions are preferred. It is also worth recalling again that today at 12:30 (GMT) a sharp increase in volatility is expected, especially if the data on the US labor market will significantly differ from the forecast values. Probably the most cautious investors will prefer to stay out of the market during this period of time. Support levels: 1498.00, 1485.00, 1474.00, 1452.00, 1440.00, 1408.00, 1380.00, 1368.00, 1310.00, 1253.00 Resistance Levels: 1520.00, 1535.00, 1555.00, 1585.00 Trading Recommendations Sell Stop 1473.00. Stop-Loss 1522.00. Take-Profit 1452.00, 1440.00, 1408.00, 1380.00, 1368.00, 1310.00, 1253.00 Buy Stop 1522.00. Stop-Loss 1473.00. Take-Profit 1535.00, 1555.00, 1585.00, 1600.00 *) For up-to-date and detailed analytics and news on the forex market visit Tifia Forex Broker website tifia.com
-
EUR/USD: Fed lowered rate for the 3rd time this year 10/31/2019 The dollar continued to decline during today's Asian session. At the beginning of the European session on Thursday, the DXY dollar index futures were trading near 97.04, 20 pips below the opening price of today's trading day and 56 pips below the opening price of the current week. The Fed expectedly lowered the rate by 0.25% to 1.75% last Wednesday. At the same time, Fed leaders signaled that there was likely to be no further rate cut before the end of this year. At the same time, Fed Chairman Jerome Powell at a subsequent press conference again recognized the state of the US economy as strong, despite partial weakness in some sectors. “There are many risks left, but I have to say that the risks seem to have weakened”, Powell said. Now market participants will follow the publication on Thursday (at 12:30 GMT) of data on consumer and personal expenses and reports on employment and business activity in the manufacturing sector on Friday (at 12:30 and 14:00 GMT). The American economy, despite the difficulties, looks more stable in comparison with other major world economies, which will lead to continued demand for US stock market assets and the dollar. The political situation in the EU itself is quite tense, Britain’s exit from the EU is still surrounded by uncertainty, and the likelihood that the United States and China will not be able to consolidate their trade truce is still high. One way or another, EUR / USD is trading at the beginning of today's European session near the mark 1.1170, 18 pips above today's open price. Despite the corrective growth, the long-term negative dynamics of this currency pair remains. In the case of the resumption of negative macroeconomic information, indicating a slowdown in the European economy, Eurodollar will resume decline. On a positive impulse received from the Fed meeting, EUR / USD broke through a strong resistance level of 1.1145 (EMA144 on the daily chart) and continued to grow during today's Asian session, reaching 2-month highs near 1.1175. Nevertheless, growth above the level of 1.1195 (EMA200 on the daily chart) is unlikely. Return to the area below the level of 1.1145 will cause the resumption of the downward trend. Support Levels: 1.1145, 1.1110, 1.1070, 1.1000, 1.0940, 1.0900, 1.0850 Resistance Levels: 1.1195, 1.1240, 1.1285 Trading Recommendations Sell by market. Sell Limit 1.1190, 1.1200. Sell Stop 1.1140. Stop-Loss 1.1220. Take-Profit 1.1110, 1.1070, 1.1000, 1.0940, 1.0900, 1.0850 *) For up-to-date and detailed analytics and news on the forex market visit Tifia Forex Broker website tifia.com
-
USD/CAD: Fed and Bank of Canada rate decisions 10/30/2019 Futures on the DXY dollar index is trading at the beginning of today's European session near 97.42, 18 pips below the opening price of the current trading week and 188 pips below 99.30, near which it was trading earlier this month, when the DXY reached its highest level since March 2017 year. And yet, despite the decline, the long-term positive dynamics of the US dollar remains. The US economy growth rates, despite signs of a slowdown, is still higher than in other developed countries. The US continues to outperform other developed economies in terms of GDP growth, which creates the preconditions for maintaining demand for US assets and the dollar. Today (at 12:30 GMT) will be published annual data on US GDP. According to the forecast, GDP in the 3rd quarter grew by 1.7% after rising by 2.0% in the previous 2nd quarter. And at 18:00 (GMT), the Fed will publish its decision on interest rates. It is widely expected that the Fed will lower its base rate by 0.25% to 1.75%. However, market participants do not have full clarity regarding further plans of the Fed. Therefore, the attention of financial market participants will be focused on the Fed press conference, which will begin at 18:30 (GMT). If Fed leaders signal that they are likely to take a break in a further rate cut in order to evaluate the results of the ongoing mitigation cycle, this could trigger a fix for short positions and a dollar growth. If the rhetoric of the accompanying statement by the Fed is soft, then the growth of stock indices and the decline in the dollar may continue. At 14:00, the Bank of Canada will publish its decision on the rate. Bank of Canada officials said last month that the economy and labor market are in good shape despite escalating trade conflicts. This creates the prerequisites for the Bank of Canada to be able to leave its key rate unchanged at the current meeting, at the same level of 1.75%. Despite the decline, the long-term positive dynamics of the USD / CAD pair remains. The pair is trading above the key and long-term support level of 1.2900 (EMA200 on the weekly chart). A break into the zone above the resistance level 1.3230 (ЕМА144, ЕМА200 on the daily chart) will resume the bullish trend of USD / CAD and direct the pair towards recent local maxima near the resistance level 1.3345. The first signal to resume purchases will be the breakdown of resistance levels 1.3100 (ЕМА200 on the 1-hour chart), 1.3138 (September lows). Support Levels: 1.3050, 1.3015, 1.2900 Resistance Levels: 1.3100, 1.3138, 1.3185, 1.3230, 1.3300, 1.3345, 1.3380 Trading Scenarios Sell Stop 1.3040. Stop-Loss 1.3110. Take-Profit 1.3015, 1.2900 Buy Stop 1.3110. Stop-Loss 1.3040. Take-Profit 1.3138, 1.3185, 1.3230, 1.3300, 1.3345, 1.3380, 1.3435, 1.3452, 1.3465, 1.3520 *) For up-to-date and detailed analytics and news on the forex market visit Tifia Forex Broker website tifia.com
-
AUD/USD: Current dynamics and recommendations 10/29/2019 Positive news on the progress of US-Chinese trade negotiations supports the Australian currency. “China is likely to sign an agreement at an economic summit in Chile next month”, US President Donald Trump said Monday. The United States and China are Australia's largest trade and economic partners, and a positive shift in trade relations between the two countries has a positive effect on the mood of consumers and investors in the Australian economy. On Wednesday (at 00:30 GMT) inflation data in Australia in the 3rd quarter will be published. It is expected that the annual consumer price index will indicate an increase in inflation in the 3rd quarter by 1.7%, which is better than the CPI for the 2nd quarter (+1.6%). At the same time, betting on further significant growth of the Australian dollar and the pair AUD / USD is not necessary. Speaking at Canberra on Tuesday, the Reserve Bank of Australia manager Philip Lowe said further interest rates are likely to drop. "If we decide to ignore these trends (the actions of the central banks of other countries), the exchange rate is likely to rise. In the current environment, this will not be useful for employment growth and achieving the inflation target", Lowe said. At the same time, higher growth rates in the US economy than in other developed countries will contribute to increased demand for US assets and the US dollar. AUD / USD remains in a long-term downtrend, trading below the key resistance level of 0.6940 (EMA200 on the daily chart). The breakdown of the short-term support level of 0.6830 (EMA200 on the 1-hour chart) will be the first signal to resume sales of AUD / USD. In this case, the targets will be the support levels 0.6680, 0.6600. The immediate goal is located at support levels 0.6810 (ЕМА50 on the daily chart), 0.6802 (ЕМА200 on the 4-hour chart). In an alternative scenario, the correctional growth of AUD / USD will be limited by the resistance levels of 0.6890, 0.6940. Support Levels: 0.6830, 0.6810, 0.6802, 0.6745, 0.6700, 0.6680, 0.6600, 0.6300 Resistance Levels: 0.6890, 0.6940 Trading Recommendations Sell Stop 0.6825. Stop-Loss 0.6865. Take-Profit 0.6810, 0.6802, 0.6745, 0.6700, 0.6680, 0.6600, 0.6300 Buy Stop 0.6865. Stop-Loss 0.6825. Take-Profit 0.6890, 0.6940 *) For up-to-date and detailed analytics and news on the forex market visit Tifia Forex Broker website tifia.com
-
S&P500: bullish trend remains valid 10/28/2019 After it became known about the progress in US-Chinese trade negotiations, growth in the US stock market accelerated. The Dow Jones Industrial Average up 0.6% on Friday to 26968.00 points. The S&P 500 on Friday increased by 0.4% to 3021.00 points, and by the end of the week gained 1.2%. According to the Ministry of Commerce of China, the trade representatives of the two countries "agreed to properly resolve key problems and confirmed that the technical consultations on some parts of the text of the agreement have basically been completed". The positive news that the parties are completing preparations for the first stage of the trade transaction also provoked an increase in the yield of US treasury bonds. US stock indexes remain positive ahead of the Fed meeting this week. The Fed is expected to cut rate by 0.25% to 1.75%. Nevertheless, if Fed leaders signal that they will take a break to evaluate the results of the mitigation cycle, this can cause a sharp increase in volatility in the financial markets and lead to profit taking in long positions in the US stock market. The market dynamics this week may also be affected by the meetings of the Bank of Japan and Bank of Canada, data from the US labor market and new corporate financial reports. On Monday (at 12:30 GMT) data on wholesale stocks in the US for September will be released. Economists expect stocks up 0.3% from the previous month after rising 0.2% in August. The increase in stocks in warehouses reflects a slowdown in the economy and negatively affects the US dollar and the dynamics of US stock indexes. If the data turn out to be better than the forecast, or lower than the previous value, this will provide additional support to the stock market and indices. The S & P500 index maintains long-term positive dynamics, trading above the key support level of 2895.0 (ЕМА200 on the daily chart). Long positions are preferred so far. In an alternative scenario and after the breakdown of support levels of 2997.0 (ЕМА200 on the 1-hour chart), 2972.0 (ЕМА200 on the 4-hour chart), S & P500 will go to support levels 2895.0, 2865.0 (Fibonacci level 23.6% of the correction to the growth from December 2018 and marks 2335.0). Further decline is unlikely. The long-term bullish trend of the US stock market remains. Support Levels: 2997.0, 2972.0, 2920.0, 2895.0, 2865.0 Resistance Levels: 3029.0 Trading Recommendations Sell Stop 2970.0. Stop-Loss 3030.0. Goals 2920.0, 2895.0, 2865.0 Buy Stop 3030.0. Stop-Loss 2970.0. Goals 3100.0, 3200.0 *) For up-to-date and detailed analytics and news on the forex market visit Tifia Forex Broker website tifia.com
-
EUR/USD: Current Dynamics 10/25/2019 On Thursday, the EUR / USD pair fell after a meeting and a press conference of the ECB. This was also facilitated by some positive macro data from the United States. Preliminary PMI for the service sector in October reached a 3-month high of 51 against 50.9 in September. Preliminary PMI for the US manufacturing sector was 51.5 after 51.1 in September. The preliminary composite Purchasing Managers Index (PMI) for the United States rose to 51.2 in October from 51 in September. This was reported on Thursday by IHS Markit. EUR / USD hit a weekly low near 1.1093. However, on Friday the decline in the dollar and the growth of EUR / USD resumed. EUR / USD remains positive, trading on Friday above important short-term support levels of 1.1104 (ЕМА200 on the 1-hour chart), 1.1055 (ЕМА200 on the 4-hour chart). Nevertheless, a more significant growth of EUR / USD is limited by strong resistance levels of 1.1150 (ЕМА144 on the daily chart) and 1.1200 (ЕМА200 on the daily chart). The upper boundary of the descending channel on the weekly chart also passes through the 1.1200 mark. In general, the long-term negative dynamics of EUR / USD remains, which speaks in favor of sales of this currency pair. A signal for sales will be a breakdown of short-term support levels 1.1104, 1.1055. The publication of important news for today is not planned. Financial market participants continue to evaluate the results of yesterday's meeting of the ECB and align their positions before the Fed meeting. The next Fed meeting on monetary policy will be held next week, and the decision on the rate will be published on Wednesday, October 30 (at 18:00 GMT). However, you should pay attention to the publication (at 14:00 GMT) of the updated release of the University of Michigan Consumer Confidence Index for October. This indicator reflects the confidence of American consumers in the economic development of the country. A high level indicates economic growth, while a low indicates stagnation. The previous indicator value (for September) is 93.2, and the preliminary release indicated an increase in the indicator to 96.0. Deviations of the indicator in one direction or another from this value will also cause a short-term movement of the dollar in the same direction. Support Levels: 1.1104, 1.1055, 1.1000, 1.0940, 1.0900, 1.0850 Resistance Levels: 1.1150, 1.1200 Trading Recommendations Sell by market. Sell Limit 1.1150. Sell Stop 1.1090. Stop-Loss 1.1220. Take-Profit 1.1055, 1.1000, 1.0940, 1.0900, 1.0850 Buy Stop 1.1220. Stop-Loss 1.1090. Take-Profit 1.1285, 1.1400 [img]https://i.postimg.cc/3wtF17p4/251019-EU-W.png[/img] [img]https://i.postimg.cc/hjwbFr2K/251019-EU-D.png[/img] [img]https://i.postimg.cc/cH6M5jMD/251019-EU-H1.png[/img] *) For up-to-date and detailed analytics and news on the forex market visit Tifia Forex Broker website tifia.com
-
WTI: despite the price increase, negative dynamics prevail 10/24/2019 In the middle of last month, the price of WTI crude oil rose sharply, approaching a strong resistance level of 63.50 (Fibonacci level 61.8% of the upward correction to the fall from the highs of the last few years near 76.80 to the support level near 42.15). The sharp rise in oil prices was facilitated by terrorist attacks on oil refineries in Saudi Arabia. However, the price could not break through this resistance level and subsequently fell, returning to the zone below the key level of 57.00 (ЕМА144, ЕМА200 on the daily and weekly charts). At the beginning of the European session, WTI crude oil is trading near 55.40 mark, through which the support level (Fibonacci 38.2%) passes, receiving support from yesterday's data on US oil reserves. Further growth and the breakdown of the resistance level of 57.00 will strengthen the bullish momentum and direct the price to the resistance level of 60.90 (July highs and the upper border of the descending channel on the daily chart) and further to the levels of 63.50, 64.40. In an alternative scenario, the signal for the resumption of sales will be a breakdown of the support level of 54.70 (ЕМА200 on the 4-hour chart). So far, a negative impulse prevails. Below the resistance level of 57.00, short positions remain preferred, while the current price increase should be considered corrective. Now, oil market participants will follow the publication on Friday (at 17:00 GMT) of the weekly report of the American oilfield services company Baker Hughes on the number of active drilling rigs in the United States. Previous reports indicated a decrease in the number of active oil platforms in the United States (to 713 units at the moment). If the report again indicates a decrease in the number of such installations, then this may give a short-term positive impetus to prices. Today, the attention of participants in financial markets will be focused at a meeting of the ECB. The decision on rates will be published at 11:45 (GMT), and the ECB press conference will begin at 12:30. Interest rates are likely to remain the same. However, the ECB's propensity to further soften its monetary policy may cause an increase in stock indices and quotes for commodities, including oil. Support Levels: 55.40, 54.70, 53.95, 53.00, 52.00, 51.30, 50.30, 49.00, 42.15 Resistance Levels: 57.00, 59.50, 60.90, 63.50, 64.40, 66.50 Trading Recommendations Sell Stop 54.60. Stop-Loss 56.10. Take-Profit 53.95, 53.00, 52.00, 51.30, 50.30, 49.00, 42.15 Buy Stop 56.10. Stop-Loss 54.60. Take-Profit 57.00, 59.50, 60.90 *) For up-to-date and detailed analytics and news on the forex market visit Tifia Forex Broker website tifia.com
-
EUR/USD: Current Dynamics 10/23/2019 Amid the weakening US dollar, EUR / USD was able to grow significantly this month, reaching on Monday a new 10-week high near 1.1180. However, below the key resistance levels of 1.1150 (ЕМА144 on the daily chart), 1.1200 (ЕМА200 on the daily chart), a long-term bearish trend remains. The small steps taken earlier this month towards a ceasefire in a trade war between China and the US are not enough to ease the uncertainties that are holding back the global economy, and uncertainty has reappeared on the Brexit issue. In this regard, the role of the dollar as a protective asset is once again becoming relevant. In September, the ECB lowered its key interest rate, which was already in negative territory, and resumed its bond purchase program. The ECB leaders promised to keep these measures in force, "until we see that the inflation prospects are stably in line" with reaching the target level. Market participants are preparing for tomorrow's ECB meeting, which will be the last under the leadership of Mario Draghi. From November 1, this post will take Christine Lagarde. The ECB's decision on rates will be published on Thursday at 11:45 (GMT), and a press conference following the ECB meeting will begin at 12:30. As previously published data showed, the annual inflation rate in the Eurozone in September slowed to 0.9%, a minimum of almost three years. The growth of the Eurozone economy has been weakening since the beginning of 2018, which forces the ECB to actively support the European economy, lowering the interest rate and expanding quantitative easing. Slowing European economies and soft ECB policies further weaken the euro. In general, the long-term negative dynamics of EUR / USD remains, which speaks in favor of sales of this currency pair. The breakdown of the short-term support level of 1.1094 will be a signal for building up short positions. Support Levels: 1.1094, 1.1047, 1.1015, 1.1000, 1.0970, 1.0900, 1.0850 Resistance Levels: 1.1150, 1.1200 Trading Recommendations Sell by market. Sell Limit 1.1150. Sell Stop 1.1090. Stop-Loss 1.1220. Take-Profit 1.1047, 1.1015, 1.1000, 1.0970, 1.0900, 1.0850 Buy Stop 1.1220. Stop-Loss 1.1090. Take-Profit 1.1285, 1.1400 *) For up-to-date and detailed analytics and news on the forex market visit Tifia Forex Broker website tifia.com