Exchange Blog Cryptocurrency Blog


Capitalcore
-
Posts
245 -
Joined
-
Last visited
Everything posted by Capitalcore
-
EURUSD Price Action and Key Economic Releases The EUR/USD forex pair, often referred to as “Fiber,” is a popular trading instrument in the forex market, representing the exchange rate between the Euro and the US Dollar. Today’s economic calendar features critical data points that could influence the EUR USD exchange rate. The Core CPI and CPI releases are expected to provide insights into inflationary pressures in the US economy, with forecasts of 0.2% and 0.1% respectively. Higher-than-expected inflation figures could bolster the USD as it may lead the Federal Reserve to maintain a hawkish stance on interest rates. Additionally, the unemployment claims report, forecasted at 236K, will shed light on the health of the US labor market. Lower-than-expected claims could further support the USD. Other factors include speeches from various FOMC members, potentially offering clues on future monetary policy directions. Traders should monitor these releases closely as they will likely create volatility in the EUR/USD pair. Image Chart Notes: • Chart time-zone is UTC (+03:00) • Candles’ time-frame is 4h. Analyzing the EUR/USD H4 chart, the pair is currently in a bullish trend, navigating between the 0.5 and 0.618 Fibonacci retracement levels. The Bollinger Bands indicate that the price recently moved from the lower band to the middle band, suggesting a shift in momentum. The tightening of the Bollinger Bands signals reduced volatility, often a precursor to a significant price movement. The last three candles have been positive, indicating a consistent upward trajectory. Additionally, the RSI indicator is hovering around 57, reflecting moderate bullish momentum on EUR-USD without being overbought. Traders should watch for potential resistance near the 1.08429 level, coinciding with the upper boundary of the current ascending channel. • DISCLAIMER: Please note that the above analysis is not an investment suggestion by “Capitalcore LLC”. This post has been published only for educational purposes. Capitalcore
-
EUR/GBP Price Analysis and Forecast The EUR/GBP forex pair has recently entered a bearish phase on the H4 timeframe, indicating a potential shift in market sentiment. The price action shows a clear break below a triangle pattern, typically signaling the start of a new trend. The Moving Average Convergence Divergence (MACD) histogram is in negative territory, and the MACD line is below the signal line, suggesting increased bearish momentum. Additionally, the Relative Strength Index (RSI) is slightly below the 50 level, aligning with the downward outlook. Image Chart Notes: • Chart time-zone is UTC (+03:00) • Candles’ time-frame is 4h. Given the current technical setup, EUR/GBP is expected to continue its decline towards the next support levels. The immediate support is around the 0.8420 mark, coinciding with recent price lows. A breach below this level could lead to further downside towards 0.8370, a historically significant support zone. Traders should closely monitor these levels to gauge potential price reactions and adjust their strategies accordingly.Upcoming economic events will play a crucial role in determining the pair’s direction. Key Eurozone indicators, such as GDP growth and inflation rates, alongside European Central Bank (ECB) policy meetings, could influence the Euro’s strength. In the UK, economic data like employment figures and Bank of England (BoE) communications will be pivotal. Strong UK economic performance or hawkish BoE signals could add further pressure on EUR/GBP, reinforcing the bearish sentiment. • DISCLAIMER: Please note that the above analysis is not an investment suggestion by “Capitalcore Ltd”. This post has been published only for educational purposes. Capitalcore
-
NZD/USD Price Analysis and Forecast The NZD/USD pair, often referred to as the “Kiwi,” presents an interesting scenario on the chart. In this analysis, we explore the implications of recent economic data and upcoming events that could influence this currency pair. The Kiwi’s H4 chart shows a well-defined Fibonacci retracement pattern, indicating critical levels of support and resistance. Recently, the price line attempted to break above the 0.236 Fibonacci level but faced significant resistance, resulting in multiple reactions at this level. This repeated inability to break above the 0.236 level suggests a strong resistance zone, causing the price to reverse and indicating potential bearish sentiment. Image Chart Notes: • Chart time-zone is UTC (+03:00) • Candles’ time-frame is 4h. Given the technical setup, the price on NZDUSD is expected to fall towards the 0.382 Fibonacci level, around the 0.61000 price mark. This level has historically acted as a support zone, and traders will be keenly observing how NZDUSD the price reacts at this level. A breach below the 0.382 level could signal a further decline, while a bounce back could suggest a potential retracement towards higher Fibonacci levels. Upcoming economic releases and events analysis could be pivotal for the news forcast of NZD/USD. A positive report indicating more exports than imports could strengthen the NZD, potentially leading to downward pressure on the NZD/USD pair if exports significantly exceed expectations. On the U.S. side, a series of influential data releases and public engagements by Federal Reserve officials, including the President of the Federal Reserve Bank of New York, could impact the USD. His participation in a panel discussion on interest rates suggests that any hawkish signals might reinforce the USD’s strength. Similarly, upcoming employment data such as the ADP Employment Change and Initial Jobless Claims could further influence market sentiment and volatility in this currency pair. These factors combined will guide traders in shaping their strategies around the NZD/USD in the coming weeks. • DISCLAIMER: Please note that the above analysis is not an investment suggestion by “Capitalcore Ltd”. This post has been published only for educational purposes. Capitalcore
-
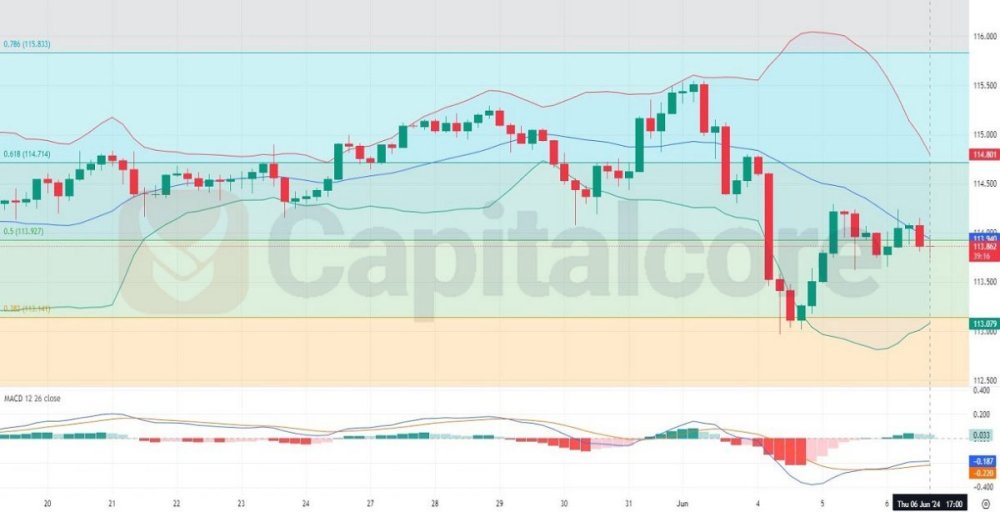
USD/JPY H4: Fundamental and Technical Overview The USD/JPY currency pair, also known as “The Ninja,” is a key barometer of the forex market, providing insights into the economic health and monetary policy stances of both the United States and Japan. The USD JPY pair’s movements are influenced by various economic indicators, central bank policies, and geopolitical events. As we look ahead to the upcoming economic data releases today, we can anticipate their potential impacts on the pair’s performance. Today, the focus is on several Japanese economic indicators, including Average Cash Earnings, Bank Lending, Current Account, and Economy Watchers Sentiment. The Average Cash Earnings forecast of 2.1% indicates modest wage growth, suggesting stable consumer spending potential, while Bank Lending at 3.1% reflects a positive borrowing environment, indicating confidence among businesses and consumers. The Current Account forecast of 2.07 trillion yen underscores a healthy trade surplus, potentially boosting the yen through increased foreign currency demand. Finally, the Economy Watchers Sentiment at 46.1 points to mild pessimism but remains a crucial gauge of consumer sentiment. In the U.S., the Consumer Credit data forecast at 10.7 billion USD suggests an increase in consumer borrowing, highlighting confidence in financial stability and spending capability. These mixed signals from Japan and steady consumer behavior from the U.S. will likely keep the USD-JPY in a state of cautious trading, awaiting more decisive trends. Image Chart Notes: • Chart time-zone is UTC (+03:00) • Candles’ time-frame is 4h. Analyzing the H4 chart of USD/JPY, we observe the price action within a descending channel following a recent peak. The Bollinger Bands show the price moving within the lower half, indicating a bearish trend. This is supported by the RSI, which has dropped below the neutral 50 level and stands at 40.61, suggesting further downside momentum. Fibonacci retracement levels reveal critical support and resistance points, with the price currently hovering around the 0.236 level at 160.191, struggling to find direction. The overall market sentiment has shifted bearish after a strong bullish trend throughout June and early July, with the last 15 candles showing a majority of bearish pressure. The current price behavior, along with these technical indicators, suggests a continuation of the bearish trend unless significant fundamental changes provide new direction. • DISCLAIMER: Please note that the above analysis is not an investment suggestion by “Capitalcore Ltd”. This post has been published only for educational purposes. Capitalcore
-
EUR/USD H4 Chart Analysis: Key Levels and Indicators The EUR/USD forex pair, often nicknamed “Fiber,” represents the exchange rate between the Euro and the US Dollar. Today, the market is particularly attentive to several significant US economic data releases, including Average Hourly Earnings, Non-Farm Employment Change, and the Unemployment Rate, which are high-impact events likely to influence USD volatility. Additionally, low-impact data from Germany and France, alongside speeches from key financial figures, could also affect market sentiment. Image Chart Notes: • Chart time-zone is UTC (+03:00) • Candles’ time-frame is 4h. In the H4 chart of EUR USD, the price has been trending positively, moving within the upper half of the Bollinger Bands and frequently touching the upper band. Among the last 16 candles, six have been bearish, including the most recent two, yet the overall EUR-USD trend remains upward. The widening Bollinger Bands suggest increasing volatility, while the RSI indicates that the market is nearing overbought conditions. The price movements align with key Fibonacci retracement levels, with resistance around the 0.382 and support around the 0.618 levels, suggesting potential areas for future price action. • DISCLAIMER: Please note that the above analysis is not an investment suggestion by “Capitalcore Ltd”. This post has been published only for educational purposes. Capitalcore
-
Analyzing USD/CAD: Economic Indicators and Trend Forecast The USD/CAD pair, often referred to as the "Loonie," due to the loon depicted on the Canadian one-dollar coin, presents an interesting scenario on the chart. In this analysis, we explore the implications of recent economic data and upcoming events that could influence this currency pair. Image Chart Notes: • Chart time-zone is UTC (+03:00) • Candles’ time-frame is 4h. The Loonie’s H4 chart shows a well-defined upward channel indicating a bullish trend in USD/CAD over the selected period. Recently, the price has tested the upper boundary of the channel and faced resistance, leading to a pullback towards the mid-line of the channel. This suggests a potential consolidation phase or a retracement before further upward movement. The resistance and support lines within the channel provide critical levels for traders to watch. If the price breaks above the current resistance, it could signal a continuation of the bullish trend, while a breach below the channel may indicate a reversal or stronger retracement. Upcoming economic releases and events could be pivotal for the news analysis of USD/CAD. From the Canadian side, the International Merchandise Trade data is due on August 6, 2024. A positive report indicating more exports than imports could strengthen the CAD, potentially leading to a downward pressure on the USD/CAD pair if exports significantly exceed expectations. On the U.S. side, a series of influential data releases and public engagements by Federal Reserve officials, including the President of the Federal Reserve Bank of New York, could impact the USD. His participation in a panel discussion on interest rates suggests that any hawkish signals might reinforce the USD's strength. Similarly, upcoming employment data such as the ADP Employment Change and Initial Jobless Claims could further influence market sentiment and volatility in this currency pair. These factors combined will guide traders in shaping their strategies around the USD/CAD in the coming weeks. • DISCLAIMER: Please note that the above analysis is not an investment suggestion by “Capitalcore Ltd”. This post has been published only for educational purposes. Capitalcore
-
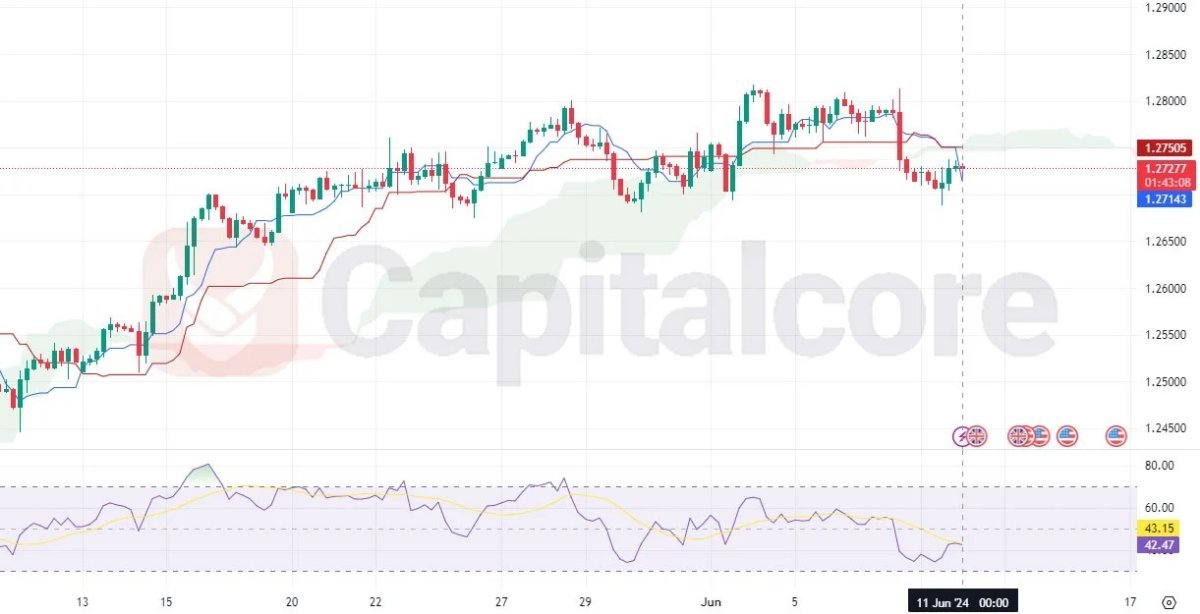
EUR/GBP Analysis and Forecast The EUR/GBP currency pair, also known as “Chunnel” due to the Channel Tunnel linking Europe and the UK, represents the exchange rate between the Euro and the British Pound. This pair is heavily influenced by economic and political events in the Eurozone and the United Kingdom. Traders often monitor it for insights into the relative strength of these two major currencies. The EUR/GBP H4 candlestick chart indicates a potential bullish phase as this price line breaks out of a bearish structure, forming higher highs and higher lows. This upward movement is supported by the price rising above the Ichimoku cloud, signaling a bullish trend. Additionally, the RSI is above 60, indicating strong bullish momentum. These technical indicators suggest that the EUR/GBP pair might continue its upward trajectory in the near term. Image Chart Notes: • Chart time-zone is UTC (+03:00) • Candles’ time-frame is 4h. The EUR/GBP H4 candlestick chart indicates a potential bullish phase as this price line breaks out of a bearish structure, forming higher highs and higher lows. This upward movement is supported by the price rising above the Ichimoku cloud, signaling a bullish trend. Additionally, the RSI is above 60, indicating strong bullish momentum. These technical indicators suggest that the EUR/GBP pair might continue its upward trajectory in the near term. Recent economic data supports this outlook. The Eurozone’s PMI figures have generally beaten expectations, with the Italian Manufacturing PMI at 45.7, French Final Manufacturing PMI at 45.4, and the overall Final Manufacturing PMI at 45.8, all surpassing their forecasts. In contrast, the UK’s economic data presents a mixed picture, with the Final Manufacturing PMI revised down to 50.9 and weaker-than-expected M4 Money Supply and Net Lending to Individuals figures. These economic divergences may further support the EUR over the GBP, bolstering the bullish sentiment for the EUR/GBP pair. • DISCLAIMER: Please note that the above analysis is not an investment suggestion by “Capitalcore Ltd”. This post has been published only for educational purposes. Capitalcore
-
AUD/USD H4 Chart Shows Bullish Momentum The AUD/USD forex pair, commonly known as the “Aussie,” is a major currency pair in the foreign exchange market, representing the exchange rate between the Australian dollar and the US dollar. AUDUSD forex pair is highly popular among traders due to its liquidity and the economic relationship between Australia and the United States. As of today, the market is anticipating several significant USD-impacting news events, including the Final Manufacturing PMI, ISM Manufacturing PMI, ISM Manufacturing Prices, Construction Spending, and ECB President Christine Lagarde’s speech. The Final Manufacturing PMI and ISM Manufacturing PMI reports are particularly influential as they provide insights into the health of the US manufacturing sector, with expectations set at 51.7 and 49.2, respectively. If the actual figures exceed these forecasts, it could bolster the US dollar, exerting downward pressure on the AUD/USD pair. Conversely, weaker-than-expected results might support the Australian dollar. Additionally, ISM Manufacturing Prices, forecasted at 55.8, will be closely watched as an indicator of inflationary pressures. ECB President Lagarde’s comments could also add volatility, depending on her stance on monetary policy. Image Chart Notes: • Chart time-zone is UTC (+03:00) • Candles’ time-frame is 4h. Analyzing the AUD/USD H4 chart, we observe that the price has been oscillating within the Bollinger Bands. Recently, the price moved from the lower band towards the middle band, reaching the upper band with three consecutive bullish candles. However, the last two candles have been bearish, indicating a potential correction but still hovering near the upper band, suggesting ongoing bullish momentum. The Bollinger Bands have widened, reflecting increased volatility. Additionally, the AUDUSD price is moving within the Fibonacci retracement levels of 0 and 0.236, indicating potential support and resistance areas. The RSI indicator is approaching overbought territory, which could imply a short-term pullback or consolidation. • DISCLAIMER: Please note that the above analysis is not an investment suggestion by “Capitalcore Ltd”. This post has been published only for educational purposes. Capitalcore
-
USDCAD H4 Analysis: Bullish Momentum Gathers Pace The USDCAD currency pair, often referred to as the “Loonie,” represents the exchange rate between the US dollar and the Canadian dollar. It is heavily influenced by commodity prices, particularly oil, as Canada is a major oil exporter. Loonie is widely traded in the forex market, reflecting economic and geopolitical dynamics between the United States and Canada. Today’s economic data for CAD includes a high-impact GDP release, forecasted at 0.3% m/m. A result exceeding this forecast would be positive for the CAD, indicating robust economic health. Conversely, the USD will see multiple low to medium impact news, such as Personal Income, Personal Spending, and speeches by FOMC members. Of particular note is the Core PCE Price Index, forecasted at 0.1%, which is a key inflation measure for the Fed. Additionally, speeches by President Biden and FOMC members could provide further insights into future monetary policy. Given the mixed nature of US economic indicators and the high importance of Canada’s GDP data, the USDCAD forex pair might see increased volatility. Chart Notes: • Chart time-zone is UTC (+03:00) • Candles’ time-frame is 4h. Analyzing the H4 chart for USDCAD, a potential uptrend is emerging following a downtrend. The price action indicates a shift as the candles move from the lower Bollinger Band to the middle and now between the middle and upper bands, signaling bullish momentum. The Fibonacci retracement levels show the price recovering from the 0.786 level, moving towards the 0.382 level at 1.37481. With 8 out of the last 10 candles being green, there is a clear positive movement in the Loonie’s price. The RSI is above 50, further supporting the bullish sentiment. The Bollinger Bands have started to widen, indicating increasing volatility and potential continuation of the upward movement. • DISCLAIMER: Please note that the above analysis is not an investment suggestion by “Capitalcore Ltd”. This post has been published only for educational purposes. Capitalcore
-
GBPUSD H4 Technical Analysis of Recent Uptrends The GBPUSD pair, commonly known as “Cable,” is a significant forex pair that tracks the exchange rate between the British Pound and the US Dollar. It is a vital financial instrument for traders due to the economic prominence of both nations. Today, fundamental analysis must consider a slew of U.S. economic data including GDP, unemployment claims, and durable goods orders, alongside British economic releases like the BOE Financial Stability Report and BOE Governor Bailey’s speech. These factors could significantly influence Cable, with stronger-than-expected U.S. data potentially bolstering the USD, while hawkish remarks from Governor Bailey could lend strength to the GBP. Chart Notes: • Chart time-zone is UTC (+03:00) • Candles’ time-frame is 4h. Analyzing the uploaded GBPUSD H4 chart, the recent price action reveals a bullish trend. The last seven candles have shown a consistent bullish momentum, progressing from the lower Bollinger band toward the middle and surging past it to touch and currently flirt with the upper band. This movement is underscored by widening Bollinger bands, indicating increasing volatility and bullish strength in the market. The RSI, hovering near the 66 mark, suggests the market is approaching overbought territory but still has room before extreme levels, supporting the potential for continued bullish behavior in the short term. • DISCLAIMER: Please note that the above analysis is not an investment suggestion by “Capitalcore Ltd”. This post has been published only for educational purposes. Capitalcore
-
Bearish Trend Signals in EURUSD: Technical Analysis In our latest analysis of the EURUSD pair, the market trend shows a bearish inclination. The recent price action indicates a potential break of structure (BOS), suggesting a short-selling opportunity. Utilizing Fibonacci retracement, we identify the optimal entry zone between the 0.618 to 0.382 levels, where the price is likely to find resistance before continuing its downward movement. Additionally, the RSI indicator supports a neutral to slightly bearish outlook, implying that the asset's performance is currently below average and not exhibiting strong momentum. Chart Notes: • Chart time-zone is UTC (+03:00) • Candles’ time-frame is 4h. Based on the USD/JPY H4 chart, the pair is currently trading within a rising channel, indicating a bullish trend on this pair. The price action of USD/JPY shows that the pair has recently tested the upper boundary of the channel around 159.60, facing resistance and showing signs of consolidation. Key support levels to watch include 159.33 and 159.11, which coincide with the lower boundary of the channel and the previous resistance turned support. The RSI indicator is currently in the overbought zone, suggesting a potential for a minor pullback before any further upward movement. • DISCLAIMER: Please note that the above analysis is not an investment suggestion by “Capitalcore Ltd”. This post has been published only for educational purposes. Capitalcore
-
USDJPY Analysis, Key Indicators and Market Movements The USD/JPY currency pair, often referred to by traders as the “Gopher,” is a significant forex pair representing the exchange rate between the US dollar and the Japanese yen. This pair is heavily influenced by the economic policies and conditions in both the United States and Japan, making it a focal point for forex traders aiming to exploit macroeconomic trends and news releases. In the context of the USD/JPY news forecast today, the Corporate Services Price Index (CSPI) and the Consumer Price Index (CPI) from the Bank of Japan play crucial roles. The higher-than-expected CSPI indicates rising costs for corporations, potentially leading to increased inflationary pressures. On the other hand, the upcoming Federal Reserve Governor Michelle Bowman’s speech could provide insights into US monetary policy, potentially impacting the USD/JPY pair. Traders should closely monitor these fundamental indicators alongside technical levels to make informed trading decisions. Chart Notes: • Chart time-zone is UTC (+03:00) • Candles’ time-frame is 4h. Based on the USD/JPY H4 chart, the pair is currently trading within a rising channel, indicating a bullish trend on this pair. The price action of USD/JPY shows that the pair has recently tested the upper boundary of the channel around 159.60, facing resistance and showing signs of consolidation. Key support levels to watch include 159.33 and 159.11, which coincide with the lower boundary of the channel and the previous resistance turned support. The RSI indicator is currently in the overbought zone, suggesting a potential for a minor pullback before any further upward movement. • DISCLAIMER: Please note that the above analysis is not an investment suggestion by “Capitalcore Ltd”. This post has been published only for educational purposes. Capitalcore
-
Technical Analysis of USD/CAD Indicators The USD/CAD forex pair, commonly referred to as the “Loonie,” is a prominent currency pair in the forex market, representing the exchange rate between the US Dollar and the Canadian Dollar. It is influenced by various factors, including economic data releases, central bank policies, and commodity prices, especially oil. Understanding its movements is crucial for traders due to its high liquidity and sensitivity to geopolitical and economic events. Today, the market anticipates several important events that could impact USDCAD. Federal Reserve FOMC members Mary Daly and Christopher Waller are set to speak, and their remarks could offer insights into future US monetary policy, potentially strengthening the USD if their tone is hawkish. Concurrently, Bank of Canada Governor Tiff Macklem is scheduled to speak, with traders keenly awaiting his comments for clues on Canada’s economic outlook and interest rate policy. A hawkish stance from Macklem could support the CAD currency, introducing significant volatility to the pair. Chart Notes: • Chart time-zone is UTC (+03:00) • Candles’ time-frame is 4h. Analyzing the H4 chart of USD/CAD, the recent price action has been oscillating between the lower and middle Bollinger Bands, indicating a bearish trend with intermittent bullish candles. The last five candles have generally moved from the lower band towards the middle band, with four out of five being bullish, including the current one. Despite this, the overall trend remains bearish, highlighted by the pattern of alternating bullish and bearish candles. The USD/CAD’s RSI indicator is positioned below 50, suggesting bearish momentum, while volumes indicate fluctuating interest. The Fibonacci retracement levels provide additional support and resistance points, aligning with the observed price movements within the Bollinger Bands. • DISCLAIMER: Please note that the above analysis is not an investment suggestion by “Capitalcore Ltd”. This post has been published only for educational purposes. Capitalcore
-
GBP/USD Technical Analysis Key Indicators The GBP/USD currency pair, often referred to by its nickname “Cable,” is a widely traded forex pair that represents the British Pound against the US Dollar. The GBP USD forex pair is known for its high volatility and sensitivity to both economic data and geopolitical events from the United Kingdom and the United States. Today, the forex market anticipates several impactful news releases for both currencies, including the UK’s Retail Sales, Flash Manufacturing PMI, and Flash Services PMI, as well as the US Flash Manufacturing PMI and Flash Services PMI. From a fundamental perspective, the GBP is poised to react to several high-impact news releases today. The Retail Sales m/m is expected to show a significant increase at 1.6%, indicating robust consumer spending which is positive for the GBP. The Flash Manufacturing PMI and Flash Services PMI are both forecasted to be above the 50.0 mark, suggesting expansion in these sectors and potentially bolstering the GBP. Conversely, for the USD pair, the Flash Manufacturing PMI is expected at 51.0 and Flash Services PMI at 53.4, both indicating expansion but not strong enough to significantly outpace the GBP data. The outcome of these reports could lead to increased volatility in the GBP-USD forex pair, especially if the actual figures deviate from the forecasts. Chart Notes: • Chart time-zone is UTC (+03:00) • Candles’ time-frame is 4h. Analyzing the GBP/USD H4 chart, several technical indicators provide insights into the pair’s recent bearish momentum. The Bollinger Bands show that the last seven red candles have moved from the upper band towards the middle band, with the last two candles touching the lower band, indicating strong bearish pressure. The bands are also widening smoothly, which usually signifies increasing volatility and the continuation of the current trend. The Parabolic SAR dots above the candles reinforce this bearish sentiment, showing no immediate signs of a reversal in the GBP USD pair. Additionally, the Fibonacci Retracement levels indicate that the price is approaching key support areas. The increasing volume in the recent bearish candles suggests that the selling pressure is strong, which could lead to further declines if the support levels are breached. • DISCLAIMER: Please note that the above analysis is not an investment suggestion by “Capitalcore Ltd”. This post has been published only for educational purposes. Capitalcore
-
EURUSD Technical Analysis on H4 Chart The EUR/USD, commonly known as “Fiber,” is the most traded currency pair in the forex market, reflecting the exchange rate between the euro (EUR) and the U.S. dollar (USD). This pair is heavily influenced by economic developments in both the Eurozone and the United States, making it a key indicator for global economic health. Today, traders are closely watching several low-impact Eurozone reports, including the German PPI m/m, ECB Economic Bulletin, Spanish 10-y Bond Auction, and Consumer Confidence. Additionally, significant attention is on high-impact U.S. data such as Unemployment Claims, Building Permits, and the Philly Fed Manufacturing Index. If the German PPI exceeds forecasts, it may provide slight bullish support for the euro. Conversely, strong U.S. data, particularly a lower-than-expected unemployment claims figure, could bolster the dollar, adding potential downward pressure on the EUR-USD pair. Chart Notes: • Chart time-zone is UTC (+03:00) • Candles’ time-frame is 4h. The H4 chart of EUR/USD indicates a bullish momentum with the last 10 candles showing six green and bullish candles. The price has been moving from the middle Bollinger Band towards the upper band, signifying potential upward movement. The Bollinger Bands have tightened compared to the previous week, indicating decreased volatility yet a bullish trend. The RSI is around 53, moving away from oversold territory, supporting a positive outlook. The EURUSD chart price action is currently around the 0.618 Fibonacci retracement level, which acts as a significant support and resistance zone. This alignment of indicators suggests a continuation of the bullish trend, provided there are no major disruptions from the upcoming economic data. • DISCLAIMER: Please note that the above analysis is not an investment suggestion by “Capitalcore Ltd”. This post has been published only for educational purposes. Capitalcore
-
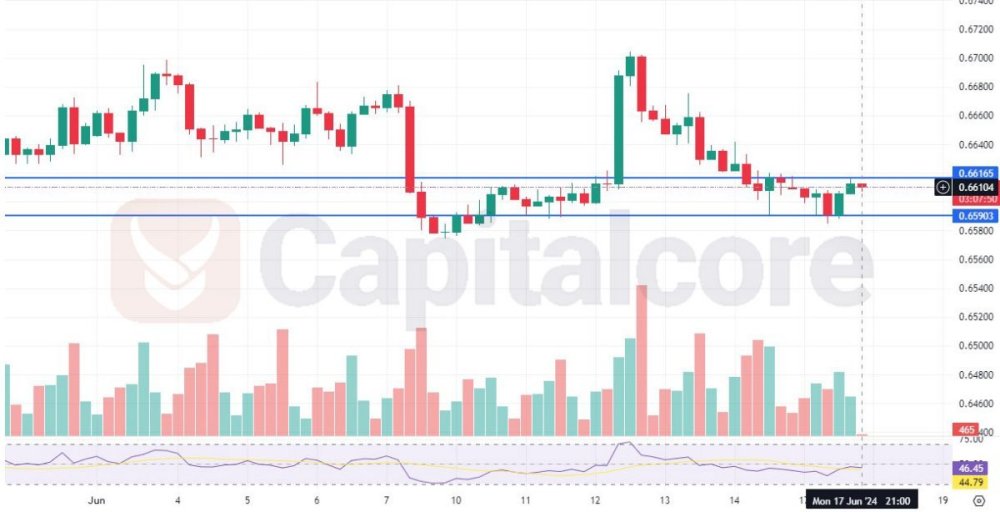
AUDUSD and Key Levels to Watch for a Breakout The AUD/USD currency pair, often referred to by traders as the “Aussie,” is a major forex pair representing the exchange rate between the Australian dollar and the US dollar. This pair is heavily influenced by the economic policies and conditions in both Australia and the United States, making it a favorite among forex traders looking to capitalize on macroeconomic trends and news releases. Chart Notes: • Chart time-zone is UTC (+03:00) • Candles’ time-frame is 4h. Based on the provided H4 chart and the recent news releases, there is an observable general bearish trend for the AUD/USD. However, recent price action suggests a potential shift towards a bullish trend, presenting a buying opportunity for traders. The support level at approximately 0.65903 has been tested multiple times, indicating a strong base, while the resistance level at 0.66165 is being approached again. This suggests that if the price breaks above this resistance, there could be a significant upward movement. In the context of AUDUSD analysis today, the recent Reserve Bank of Australia’s hawkish outlook and the Federal Reserve’s resource utilization data could further impact the pair’s movement, providing traders with opportunities to capitalize on these economic indicators. This detailed AUDUSD technical analysis today highlights the crucial levels and potential breakout points that traders should watch for, reinforcing the importance of staying updated with AUDUSD forecast live for informed trading decisions. • DISCLAIMER: Please note that the above analysis is not an investment suggestion by “Capitalcore Ltd”. This post has been published only for educational purposes. Capitalcore
-
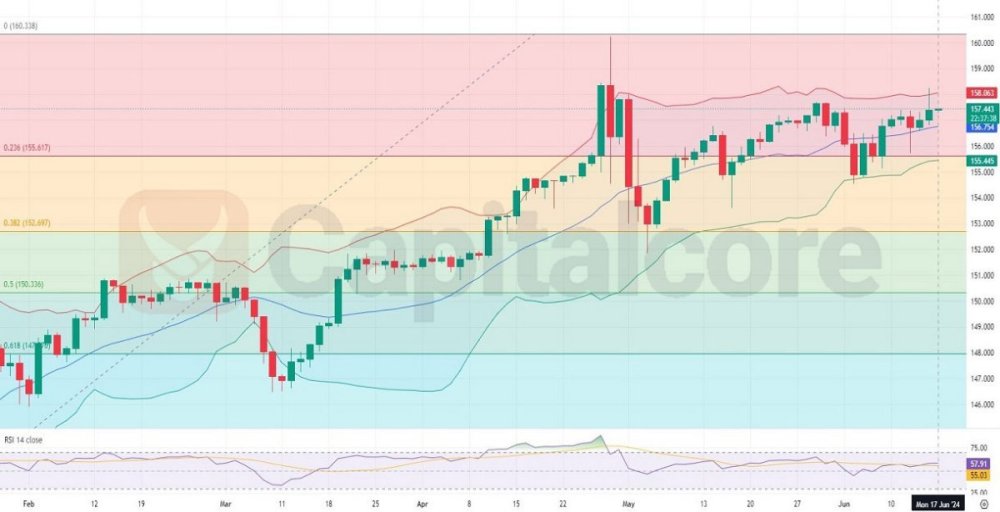
Analyzing USDJPY with Bollinger Bands and RSI The USDJPY forex pair, often referred to by its nickname “Gopher,” represents the exchange rate between the US dollar and the Japanese yen. As one of the most traded currency pairs in the forex market, it is influenced by the economic activities of the United States and Japan. Traders closely monitor this pair for its high liquidity and the impact of economic indicators from both countries. Fundamental analysis for today suggests that the USDJPY might experience some volatility due to key economic data releases. From Japan, the Core Machinery Orders m/m report is expected, with a forecast of -2.9%. This low-impact indicator reflects changes in the total value of new private-sector purchase orders placed with manufacturers for machines, excluding ships and utilities. A higher-than-expected value would be positive for the JPY. Meanwhile, the US will release the Empire State Manufacturing Index, with a forecast of -12.5, indicating worsening conditions if the actual figure is below 0.0. Given its high impact, a better-than-expected result could boost the USD, as it is a leading indicator of economic health based on surveyed manufacturers in New York state. These contrasting data releases could create a dynamic trading environment for USDJPY forex pair today. Chart Notes: • Chart time-zone is UTC (+03:00) • Candles’ time-frame is 4h. Analyzing the H4 chart of USDJPY, we observe several technical indicators. The recent price action shows the last ten candles moving from the lower Bollinger Band toward the upper band, crossing the middle band. The last six candles have remained in the upper half of the Bollinger Bands, with the most recent three candles being green and one bearish. The current candle is bullish so far. Bollinger Bands have tightened slightly, indicating reduced volatility, but are not tight enough to signal an imminent breakout. The RSI is positioned above the 50 level, suggesting a bullish momentum of USDJPY. The visible Fibonacci levels indicate key support and resistance zones that traders should watch. Overall, the chart signals a cautiously bullish sentiment, with potential resistance around the 158.063 level and support near 155.617. Capitalcore
-
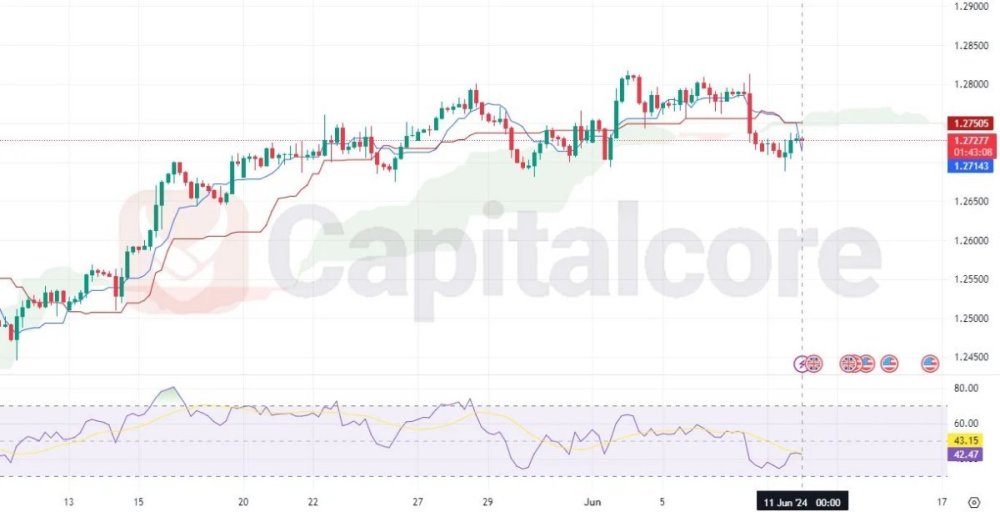
GBPUSD Bearish Wave and Recovery Potential The GBP/USD H4 price chart has experienced a significant bearish wave, with the price line descending well below the Ichimoku cloud, indicating a strong downtrend. However, recent GBPUSD candlestick patterns on this pair’s price chart suggest a potential recovery. Notably, the formation of a Morning Star pattern, a powerful bullish reversal signal, hints at a possible upward momentum. This pattern is often seen as a reliable indicator that the bears are losing control, and the bulls may take over, making it a crucial point for traders looking for a trend reversal, as predicted by price action analysis on this pair. Chart Notes: • Chart time-zone is UTC (+03:00) • Candles’ time-frame is 4h. Additionally, the Relative Strength Index (RSI) on the H4 price chart of the pair is showing positive divergence, reinforcing the recovery potential for GBP/USD. This divergence occurs when the RSI indicator forms higher lows while the price forms lower lows, suggesting that the bearish momentum is weakening. For clients seeking GBP/USD technical analysis and price prediction, these technical signals provide valuable insights. As the pair may be gearing up for a bullish reversal, traders should monitor these indicators closely, as well as the price behavior on the pair, considering the possibility of a strategic entry point in anticipation of a rebound. Captalcore
-
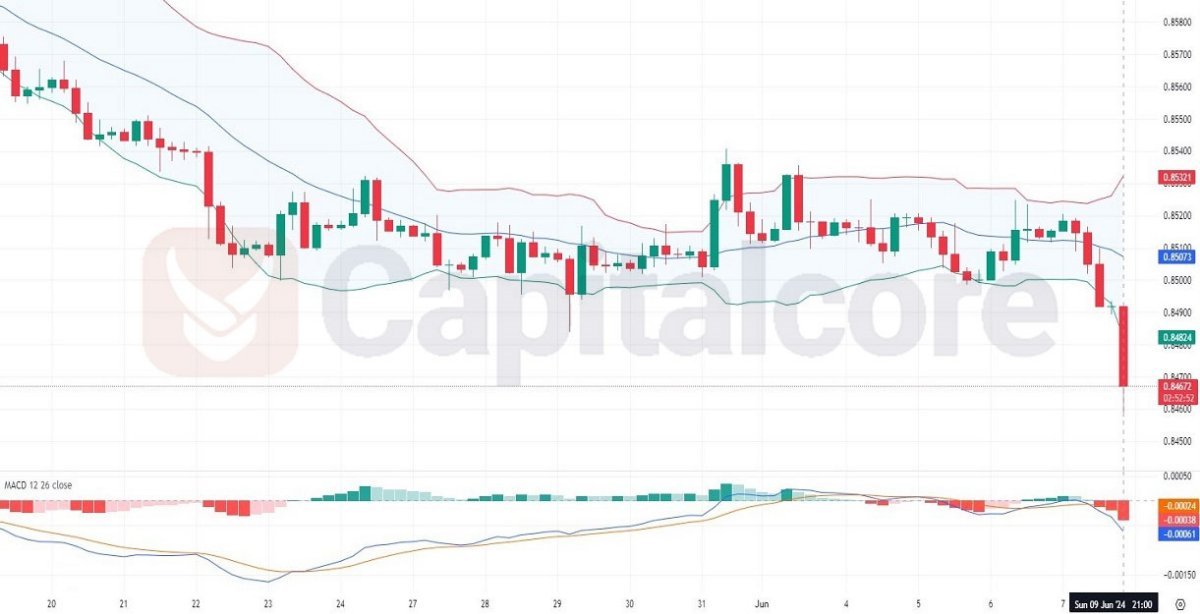
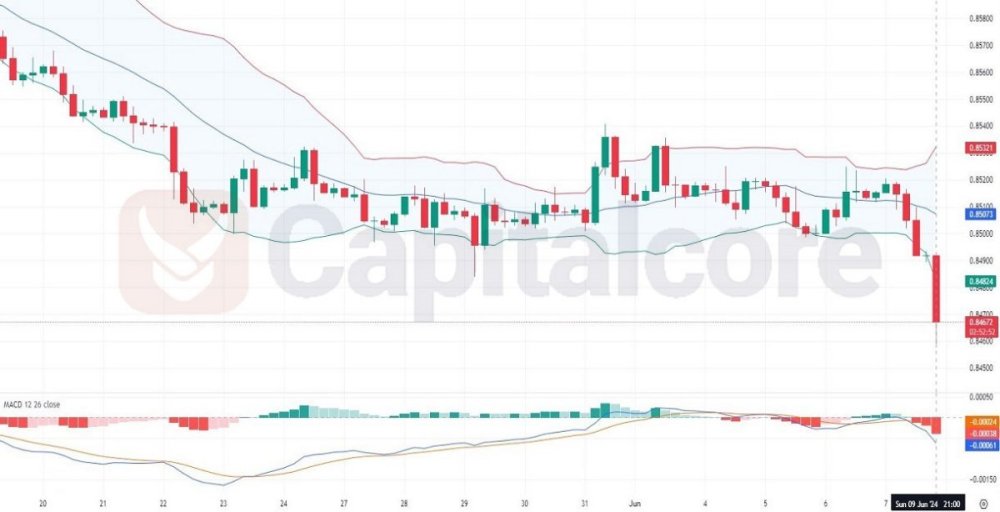
EURGBP Technical Breakdown and Fundamental Impacts The EUR GBP forex pair, commonly referred to as “Chunnel,” represents the exchange rate between the Euro and the British Pound. This pair is a crucial indicator of economic relations between the Eurozone and the United Kingdom, making it a popular choice among forex traders. In today’s context, the EURGBP forex pair is influenced by various upcoming economic events and fundamental factors. Fundamentally, the EUR/GBP pair might experience subtle fluctuations due to the low-impact economic news from the Eurozone. The Italian Industrial Production m/m is forecasted to grow by 0.3%, and a higher-than-expected figure could slightly strengthen the Euro. Similarly, the Sentix Investor Confidence index, with a forecast of -1.5, if it exceeds expectations, could boost investor sentiment towards the Euro. Additionally, a speech by German Buba President Joachim Nagel could provide insights into future ECB monetary policy, potentially affecting the Euro’s strength. However, given the low impact expected from these events, significant volatility is not anticipated unless there are unexpected remarks or data. Chart Notes: • Chart time-zone is UTC (+03:00) • Candles’ time-frame is 4h. Analyzing the EUR/GBP H4 chart price, the recent candlestick patterns reveal a strong bearish momentum. The last five candles have moved sharply from the middle Bollinger Band towards the lower band, with the last three candles touching the lower band, indicating increased selling pressure. The Bollinger Bands have widened significantly, reflecting heightened market volatility and further bearish sentiment in EUR-GBP price. Additionally, the MACD indicator shows the MACD line crossing below the signal line, reinforcing the bearish trend. This technical setup suggests that the EUR/GBP pair is likely to continue its downward movement in the near term, barring any major fundamental shifts. Capitalcore
-
CADJPY H4 Chart Key Insights and Technical Analysis The CADJPY forex pair, representing the Canadian Dollar versus the Japanese Yen, is a critical currency pair in the forex market, frequently influenced by economic indicators from both Canada and Japan. The CADJPY forex pair is affected by various factors including commodity prices, economic policies, and trade relations between these two major economies. Traders often look at this pair to gauge risk sentiment and the overall health of the Canadian and Japanese economies. Today, the CADJPY chart price may experience significant movements due to several high-impact economic announcements from Canada. The Employment Change report, forecasted at 24.8K, is crucial as it reflects the number of employed people, and a higher-than-expected number would be favorable for the CAD. Additionally, the Unemployment Rate, predicted to be 6.2%, is another vital indicator, where a lower-than-expected rate would indicate a healthier economy, boosting the CAD. The Capacity Utilization Rate, though of low impact, provides insight into the efficiency of resource usage in the Canadian economy, and a higher rate is considered positive. On the Japanese side, household spending and leading indicators are expected to have a low impact, with forecasts of 0.6% and 111.6%, respectively, providing a backdrop for potential minor influences on the JPY currency. Chart Notes: • Chart time-zone is UTC (+03:00) • Candles’ time-frame is 4h. Analyzing the CADJPY H4 chart, we observe the pair trading within Bollinger Bands, recently moving from the lower band towards the middle band. The MACD indicator shows a recent bullish crossover, indicating a potential upward momentum. However, the last five candles, after touching the middle band, have turned red and bearish, suggesting some resistance near the middle band. The Bollinger Bands have slightly tightened, indicating a decrease in volatility, although they remain wider compared to the past two weeks. The overall trend appears cautiously optimistic, with the price oscillating around the middle band, hinting at a possible consolidation phase before a significant move. Capitalcore